Curated OER
Pictograms of Haircuts
In this math worksheet, students convert the data into numbers from the pictograms. The graphic organizer gives information for the 8 follow up questions.
Curated OER
Pictograph Activity
In this pictograph worksheet, learners learn to read a pictograph and answer questions based on the data. Students then draw two of their own pictographs using the given information and answer questions based on graphs.
Curated OER
M&M Graphing and Probability
Students create a variety of graphs. They count, sort, and classify M&M's by color and record data on a chart. They use data from the chart to create pictographs, bar graphs and circle graphs. They analyze data and determine...
Curated OER
Types of Graphs
Fifth graders construct graphs. For this graphing lesson, 5th graders learn about various types of graphs such as bar, line, circle, picture and stem and leaf plot. Students work in groups to create examples of each graph.
Curated OER
Pictograms: Animals in the Zoo
In this math worksheet, students examine a pictogram which shows data about how many of 5 species of animals live in the zoo. Students answer 7 word problems about the pictogram.
Curated OER
Data From Interviews
Middle schoolers create and conduct a survey about favorite foods, gather and represent the data, interpret data and make predictions to present to the class. They create and use interview questions to gather data. Pupils are...
Curated OER
Probability and Statistics
Elementary schoolers choose from a host of activities to investigate probability and statistics. They complete worksheets, create 3-D graphs, and play graph bingo. They make weather predictions and list all the possibilities before going...
American Statistical Association
The Taste of Yellow
Does lemonade taste better when yellow? A tasty experiment has scholars determine the answer to the question. It requires conducting a taste test with lemonades of different colors (from food coloring), and then collecting and analyzing...
CK-12 Foundation
Mode: Mucho Money
Generate stacks of money. Given bills of different denominations, pupils stack them based on their values. The learners figure out which value is the mode of the data and determine whether the data is unimodal, bimodal, or multimodal.
Pennsylvania Department of Education
Months of the Year
Students develop a pictograph using the months of the year. In this months lesson, students place their name with their birth month on a large pictograph. They discuss the information they can see on the graph using the proper names for...
Curated OER
Understanding Statistics
In this statistics worksheet, students examine and interpret pictographs and line graphs. Students analyze the provided data in order to create bar graphs, circle graphs, and box and whisker plots. The nine page worksheet accompanies a...
Curated OER
Zoo Favorites
First graders construct a class picture graph and tally grid that show their favorite zoo animals. They discuss the information the graphs show and complete a personal graph based on the class example.
Curated OER
Dealing With Data
Students collect, organize, and display data using a bar graph, line graph, pie graph, or picture graph. They write a summary describing the data represented and compare the graph to another graph in the class.
Curated OER
Pictogram 1 and 2
In this mathematical worksheet, young scholars experience problem solving two pictograms dealing with favorite animals and rainy days.
Curated OER
Gone Fishing
Students particapate in a lesson on pictographs describing different fish. They observe the columns in the pictographs in order to determine which ones have the most fish and different types of fish. They create their own pictographs.
Curated OER
Bald Eagle Population Graphing
Students create graphs to illustrate the bald eagle population. They identify the population of bald eagles in Minnesota and the United States. They create three graphs to represent the population data including a line, bar, and...
Curated OER
How Do You Get Home from School?
First graders create pictographs and interpret results of transportation home from school.
Curated OER
Timed Multiplication Test Graphs
Students use the tools of data analysis for managing information. They solve problems by generating, collecting, organizing, displaying histograms on bar graphs, circle graphs, line graphs, pictographs and charts. Students determine...
Curated OER
Connecting With Coordinates
Play a coordinates game to encourage collaborative learning and grid use! Learners plot points on grids and play a game that challenges them to locate a specific point on a coordinate grid by using horizontal and vertical movements.
Curated OER
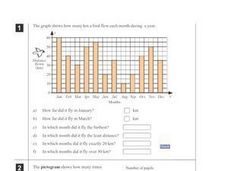
Graphs and Pictograms
In this graphs and pictograms worksheet, students analyze both a graph and a pictogram and then answer 11 questions about them. Students can click on the Check button to determine whether their answers are correct or not.
Curated OER
Weather Observation Journal
Students record weather for a period of one month. In this weather lesson, students observe weather for one month on a large pictograph. Students record clouds, wind, temperature and any other weather conditions they observe. Students...
Curated OER
Graph Club 2.0 Matching
Second graders study graphing using pictographs and bar graphs. They graph pie charts, line graphs, and also change the graph scale up to 1000. They use the pictograph on the left to create the same graph on the right using a bar graph.
Curated OER
Data Analysis, Probability, and Discrete Mathematics
Fourth graders analyze the data in a bar graph, pictograph, line graph, and a chart/table and draw conclusions based on the data. They discuss each type of graph, write questions for each graph, and analyze the data as a class.
Curated OER
How Many People Live in Your Household?
Students create a pictograph showing household size for the class.In this data collection and graphing lesson, the teacher guides students through the creation of a concrete object graph, then students analyze and summarize the results.


