Curated OER
C is for Cookie-A MEAN-ingful Graphing Activity
Third graders, in groups, dissect a variety of brands of chocolate chip cookies and calculate the mean for each brand. They create their own bar graphs, pictographs, and line graphs to represent information.
Curated OER
Getting A Grip On Graphs
Fourth graders investigate the concept of graphing and comparing different types of data using pictographs, line graphs, scatter plots, etc... They gather data and make interpretations while examining the medium of how it is displayed.
Curated OER
The Egg Hunt- Using a Graph to Answer Data Questions
In this pictograph worksheet, students answer questions based on a pictograph that shows colored Easter eggs. They follow the key that shows that each egg picture is equal to 10 eggs. They fill in the blanks with answers to how many, who...
Curated OER
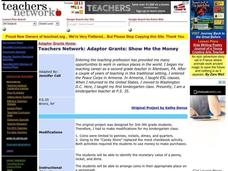
Show Me the Money
Young scholars study the monetary value of a penny, nickel, and dime. They simulate a candy store by calculating the proper amount of money needed to purchase candy. After viewing a video, they complete the "Handful of Coins" pictograph .
Curated OER
Pumpkin Seed Data!
Second graders work with pumpkins to estimate, then accumulate data about pumpkin seeds. After cleaning out the pumpkins, 2nd graders utilize a worksheet imbedded in this plan which has a variety of pumpkin math activities they can do.
Curated OER
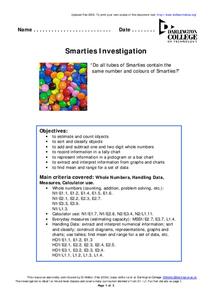
Smarties Investigation
In this math instructional activity, students participate in an investigation of Smarties candy. For example, students estimate how many candies they have in each color, count the actual number, and record the information in a tally chart.
Alabama Learning Exchange
Three in a Row Calendar Game
Young scholars explore a calendar. In this calendar and math instructional activity, students view a video clip about using a calendar. Young scholars participate in a game in which a game board is used to identify days of the week,...
Curated OER
Halloween Graphitti
Learners complete multi-curricular activities in a Halloween themed lesson. In this Halloween lesson, students examine newspaper ads to find prices of pumpkins and use them to complete a stem and leaf plot. Learners find the diameter,...
Curated OER
Apples Galore! (Elementary, Language)
Fifth graders examine and taste 7-8 difference apples, describe the flavor/texture, then graph the results of favorites. Finally students write a paragraph describing their favorite.
Curated OER
"Graph It"
Students work in teams to conduct short surveys of their classmates. They show their results using at least two different types of graphs.
Students separate into teams and are asked that each team to choose something that they are...
Curated OER
Gummy Bear Color Graph
In this graphing worksheet, students see color 5 color words at the bottom of a graph that contains black line pictures of gummy bears. There are no directions or questions given with the graph.
Curated OER
Candy Land Math
Students order numbers and sets of objects from 0 through 10 and organize and interpret information collected from the immediate environment. They read and interpret graphs usin real objects and the computer. Finally, students sort a...
Alabama Learning Exchange
Ice Cream Sundae Survey
Young scholars analyze data through graphs. They will complete a class survey on ice cream sundaes and tally and graph the responses. They then analyze the information from the class graph.
Curated OER
Many Ways to Represent Our Data
Demonstrate several ways to represent data with your class. They will use surveys to gather data and display the data using tally charts and graphs. Then answer questions according to the data.
Pennsylvania Department of Education
Volume and Surface Area
Build boxes using unit cubes to compare surface area and volume. The group performs multiple experiments to determine properties of volume, such as if it makes a difference which order the dimensions are multiplied in. Extensive...
Curated OER
Algebra 2 Desmos Graphing Project
Encourage class members to get creative with functions. Pairs write their names and draw pictures using a graphing application with a collaborative graphic project. The resource provides the requirements for the project, as well as a...
Curated OER
When Ants Fly
Here is a great lesson on constructing line graphs. Learners identify common characteristics of birds, ants common needs of all living things. They also write a story from the perspective of an ant or a bird that has lost its home and...
Alabama Learning Exchange
Yummy Apples!
Young learners listen to a read aloud of Gail Gibbons book, Apples and the story A Red House With No Windows and No Doors. They compare characteristics of a number of kinds of apples, graph them and create a apple print picture. Learners...
Curated OER
Data Collection and Presentation
Middle and high schoolers collect and analyze data from four different activities. The activities include information about classmates, tallying colors of cars in a parking lot, stem and leaf plots, and making a histogram from winning...
Curated OER
Build a Bar Graph
Learners discover how to use bar graphs. They will gather and organize specific data in order to put it into a bar graph. Then they will answer several questions based on the information they have graphed.
Curated OER
Measuring Volume/Capacity Using the Metric System
There is more than one way to measure an amount, as learners discover by applying multiple measurement tools in these activities. Centimeter cubes, cylinders, beakers, and measuring cups are used to find the volume of regular and...
Curated OER
The Gathering and Analysis of Data
Young mathematicians gather data on a topic, graph it in various forms, interpret the information, and write a summary of the data. They present their data and graphs to the class.
Curated OER
Graphs and money
In this graphs and money worksheet, students complete word problems about different kinds of graphs and money in those graphs. Students complete 10 multiple choice problems.
Curated OER
Picture Graphs
First graders work with picture graphs, create their own individual graphs, and construct and read graphs.


