NASA
Lava Layering
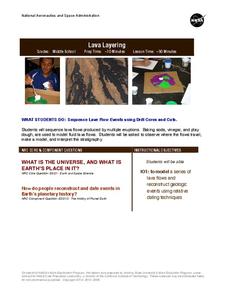
Take the old baking soda and vinegar volcano to the next level by using it to study repeated lava flows over time, examine geologic features on Earth and Mars, and speculate about some of the formations on Mars.
Willow Tree
Histograms and Venn Diagrams
There are many different options for graphing data, which can be overwhelming even for experienced mathematcians. This time, the focus is on histograms and Venn diagrams that highlight the frequency of a range of data and overlap of...
Concord Consortium
Bricks for Books
Maximize a profit with an understanding of geometric dimension. A real-world task challenges learners to design a pattern using three different brick shapes. The bricks are dedicated with a different donation for each shape, so part of...
Curated OER
Assessing the quality of habitat for Monarch Butterflies
Students use different sampling methods to determine the population size and appropriate space for monarch butterflies. In this averages lesson plan, students complete word problems where they can accurately estimate the size of an...
Curated OER
Calculating and Applying Basic Probability
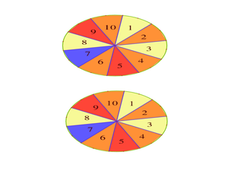
Eighth graders investigate the basic concepts of probability. In this probability lesson, 8th graders learn the associated probability. They work with spinners, colored cubes in a bag, flip coins, and choose colored candies while they...
Texas Instruments
Probability of Repeated Independent Events
Statisticians analyze different samples to find independent and dependent events. For this probability lesson, pupils predict the outcome and then calculate the real outcome. They create a tree diagram to help predict the probability of...
Curated OER
Lucky 7s
This helpful lesson explores the probability in tossing a coin and throwing dice. Specifically, it looks at the probability of getting numbers that are significant to the game of craps, assuming that once the math is understood, most...
Curated OER
Wide Open Spaces
Students examine the problem of groundwater pollution. In groups, they develop a solution to solve the problem of a local polluted water source. They also practice measuring the space between sediment particles and the rate of water flow.
EngageNY
Chance Experiments with Outcomes That Are Not Equally Likely
The fifth portion of the 25-part series introduces probabilities calculated from outcomes that are not equally likely. Class members use tables to calculate probabilities of events, add outcome's probabilities, and find complements....
Inside Mathematics
Marble Game
Pupils determine the theoretical probability of winning a game of marbles. Individuals compare the theoretical probability to experimental probability for the same game. They continue on to compare two different probability games.
Curated OER
Review for the Second Exam -
For this probability worksheet, students solve eight math problems involving various scenarios enveloped with the concept of probability. Lastly analyze specific data frequencies to draw a histogram.
EngageNY
The Difference Between Theoretical Probabilities and Estimated Probabilities
Flip a coin to determine whether the probability of heads is one-half. Pupils use simulated data to find the experimental probability of flipping a coin. Participants compare the long run relative frequency with the known theoretical...
Curated OER
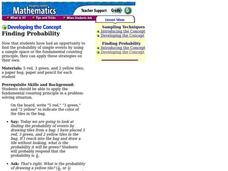
Finding Probability
Young scholars demonstrate how to find the probability of events. In this probability lesson, students use colored tiles in a paper bag and randomly select one at a time to record the probability.
Virginia Department of Education
Organizing Topic: Probability
The probability is high learning will occur! A well-designed unit introduces learners to the concepts of independent, dependent, and mutually exclusive events. Using Venn diagrams, the lessons ask learners to analyze many different...
CCSS Math Activities
Baseball Players
Statistics is an important part of baseball. Given the mean weight of players on a baseball team, scholars determine the total weight of the players. They then find the median and range of weights for the opposing team. Lastly, they...
Curated OER
Atlatl Lessons Grades 4-12: Lesson for Beginning Users of Atlatl
Sixth graders determine the mean, range median and mode of a set of numbers and display them. In this data lesson students form a set of data and use computer spreadsheet to display the information. They extend of the process by looking...
Curated OER
Deep Sea Drilling
Students explore ocean vessels that drill the ocean floor. For this ocean drilling lesson, students watch videos about drilling the ocean floor and discuss. Students get into groups, go outside and use string to mark off the amount of...
Curated OER
Creating AB Patterns
Students work with patterns. In this pattern lesson, students find AB patterns in nature and the manmade world. They create their own AB pattern using math manipulatives and visual arts.
Curated OER
Place Value Charts to the Millions Place
In this math activity, students learn to read, write, order and compare numbers and place them on a place value chart. Students begin the 4 pages of exercises by studying a sample place value chart. Students then fill out 3 other charts...
Curated OER
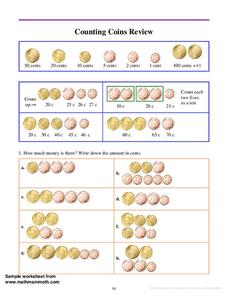
Counting Coins Review
In this money worksheet, students review the techniques for counting coins. Students count 8 different collections of coins. Students write the total amount of each collection in the space provided.
Curated OER
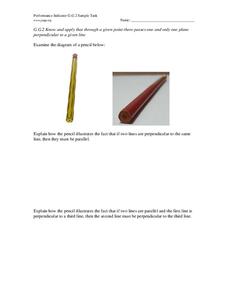
Line, Planes and Points
In this geometry learning exercise, 10th graders create visuals to help them understand the position of a point, line and plane in space or on a coordinate plane. There are 3 questions.
Curated OER
Modeling Conditional Probabilities 1: Lucky Dip
Check out this detailed lesson plan on conditional probability! Learners work individually and also collaboratively to analyze the fairness of a game and justify their reasoning. it includes detailed notes and many helpful suggestions...
Curated OER
Worksheet 28 - Fall 1995
In this math worksheet, students define a definite integral. Then they draw a picture or sequence of pictures with progressively finer partitions..
Curated OER
Maps Not Drawn to Scale
In this maps worksheet, students redraw a map to make it more accurate and drawn to scale in the space given. Students draw 1 map and answer 2 questions.


