Curated OER
Math: Giant Alaskan Cabbages
Students analyze data from the Alaska State Fair's "Giant Cabbage Weigh-Off." Once they have sorted the weights, they calculate the range, mean, mode, and median of the cabbages. Finally, students create posters displaying their...
Willow Tree
Box-and-Whisker Plots
Whiskers are not just for cats! Pupils create box-and-whisker plots from given data sets. They analyze the data using the graphs as their guide.
Michigan State University
In Search of Life
Explore the habitats around you with an activity that takes kids out of the classroom to learn about the local variety of habitats and the living things that call them home. In small groups, scholars investigate their surroundings,...
Curated OER
Investigation - How Tall is the Average Sixth Grader?
Learners will measure each other and record the data in inches. They will use a stem and leaf plot to display data and figure out the average height of the students in a class. The other statistical data will be collected like the mode...
Curated OER
Using Averages to Create Graphs Through Excel
Sixth graders create and use a spreadsheet to make graphs which will be used to analyze Progress Report and Final Report Card grades. They practice finding the mean, median, mode, and range of a data set. Students also incorporate column...
Curated OER
Lesson #46: Bar Graphs and Line Graphs
In this bar graphs and line graphs worksheet, students interpret bar graphs, line graphs, and box-and-whisker plots. They find the measures of central tendency. This three-page worksheet contains notes, vocabulary, and approximately 10...
Polar Trec
How Much Data is Enough?
The next time you read a magazine or watch the news, make note of how many graphs you see because they are everywhere! Here, scholars collect, enter, and graph data using computers. The graphs are then analyzed to aid in discussion of...
Curated OER
Describing Data
Your learners will practice many ways of describing data using coordinate algebra in this unit written to address many Common Core State Standards. Simple examples of different ways to organize data are shared and then practice problems...
Illustrative Mathematics
Puppy Weights
Nobody can say no to puppies, so lets use them in math! Your learners will take puppy birth weights and organize them into different graphs. They can do a variety of different graphs and detail into the problem based on your classroom...
Curated OER
"M&M's"® Candies Worksheet 2
In this math worksheet, learners plot the mean, median, and mode for the colors of M and M candies by filling in the graphic organizer.
Curated OER
Assessing Normalcy
Students define normal distribution as it relates to the bell curve. In this statistics lesson, students use the central tendencies of mean, median and mode to solve problems. They plot their data and draw conclusion from the graphs.
Curated OER
Standard Deviation
In this algebra activity, students identify the mean, median and mode. They use the standard deviation to solve problems. There are 10 questions with an answer key.
Curated OER
Putting Your Best Foot Forward
Third graders measure their feet and their parents' feet, record data on computer-generated graphs, and calculate and record mean, median, and mode.
Curated OER
Tech Algebra: A Statistics Study
Students use the internet to gather a minimum of thirty pieces of data. Students create box and whisker graphs, and stem and leaf plots from the information. They calculate mean, median, mode, and range. Students write a summary and...
Curated OER
Data Collection Project
Students collect data using email. They calculate the mean, median, mode, range and outliers. They create a graph using the data results. They write five paragraphs to summarize their data.
Curated OER
Statistics
In this statistics worksheet, students solve and complete 6 different problems that include determining various types of statistics. First, they determine the data set where the median value is equal to the mean value. Then, students use...
Curated OER
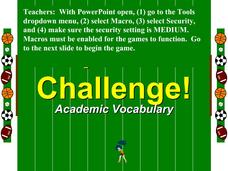
Academic Vocabulary: Sports Challenge
This PowerPoint enables students to review mathematical terms in an interactive review game format. The slides contain a question about a mathematical term and the students must answer with the correct vocabulary word in order to get...
Curated OER
Misleading Statistics
In this misleading statistics worksheet, students identify misleading graphs. They determine the mean, median and mode of given data. Students determine the measure of central tendency which accurately describes the data. This one-page...
Curated OER
Finding Range
In this range worksheet, students enter mean, median and mode for sets of number, then enter the range.
Curated OER
Fall Leaves
For this fall leaves worksheet, students identify the colors of leaves and determine the number they have of each. This worksheet may be used in elementary grades, for color identification and counting purposes. For the middle school...
Shodor Education Foundation
InteGreat
Hands-on investigation of Riemann sums becomes possible without intensive arithmetic gymnastics with this interactive lesson plan. Learners manipulate online graphing tools to develop and test theories about right, left, and midpoint...
Curated OER
Averages
In this averages worksheet, 6th graders solve and complete 3 various types of problems. First, they find the mean, mode, median and range for each set of data shown. Then, students match each team to the picture shown that they think...
Curated OER
Statistics Newscast in Math Class
Students study sports teams, gather data about the teams, and create a newscast about their data. In this sports analysis instructional activity, students research two teams and define their statistical data. Students compare the two...
Curated OER
Collecting Data and Graphing
Eighth graders, in groups, count the different colors of M&M's in each kind of package and then draw a pictograph to show the results. Each group writes a program to show their results and then compare the manually-drawn and computer...
Other popular searches
- Math/data Mean Mode Median
- Math Ata Mean Mode Median
- Math/ Mean, Mode, Median
- Math at Mean Mode Median
- Math Median Mode Mean
- Math/ Mean Mode Median


