EngageNY
Graphing Rational Functions
Put everything together in a picture. Scholars take what they learned in the previous three lessons in the 15th segment of a 23-part unit to graph rational functions. They find the end behavior, the horizontal and vertical asymptotes if...
EngageNY
Horizontal and Vertical Asymptotes of Graphs of Rational Functions
Get close to your favorite line. Scholars use end behavior to help find horizontal asymptotes. With the understanding of domains of rational functions, learners find vertical asymptotes and then use graphing calculators to verify the...
EngageNY
Comparing Rational Expressions
Introduce a new type of function through discovery. Math learners build an understanding of rational expressions by creating tables and graphing the result.
Kenan Fellows
Attack of the Aphids!
Insects threaten the food production industry, and aphids are one of the big players! Analyzing data of aphid populations gives insight into their behaviors. Learners model the population data of an uninhibited population with an...
Curated OER
American Indian Flute and Math
Students investigate the Math behind Musical instruments in this cross-curricular Math lesson on the Native American Flute and waveforms. The lesson can be accomplished in 6 days and includes an extensive materials list for successful...
Curated OER
Modeling Mania Math Topic: Using Models
Students examine problem solving techniques when working on spatial problems. They discover how models, sketches, and drawings can be used to understand on something works. They design a model of a bridge using given dimensions and...
Curated OER
Matchstick Math: Using Manipulatives to Model Linear, Quadratic, and Exponential Functions
Playing with matches (unlit, of course) becomes an engaging learning experience in this fun instructional unit. Teach pupils how to apply properties of exponential functions to solve problems. They differentiate between quadratic and...
Curated OER
Math Handbook: Calculus
If only there was a reference that listed all the formulas covered in calculus. Luckily, there is. This comprehensive 197-page handbook provides formulas and explanations for all topics in AP Calculus or in a standard college calculus...
Federal Reserve Bank
Your Budget Plan
What do Whoosh and Jet Stream have in common? They are both characters in a fantastic game designed to help students identify various positive and negative spending behaviors. Through an engaging activity, worksheets, and...
Balanced Assessment
Local and Global Behavior
Create rules for numerical sequences. Pupils develop local rules and recursive rules for number sequences. The sequences are linear, quadratic, and cubic in nature. Scholars find that some local rules do not work, no matter where in...
Mathematics Vision Project
Module 6: Modeling Periodic Behavior
Around and around we go ... again, and again, and again, and again! That's the nature of a periodic function. Young scholars learn how to model a periodic pattern with trigonometric functions. The nine-lesson unit explores the connection...
Flipped Math
Calculus AB/BC - Exploring Behaviors of Implicit Relations
Put everything together implicitly. Pupils use their knowledge of implicit differentiation to determine whether a curve is increasing or decreasing or its concavity. Given a differential equation, scholars determine whether a specific...
Curated OER
Polynomial Functions
In this Pre-Calculus/Calculus worksheet, students graph polynomial functions, identifying the x- and y-intercepts as well as end behavior. The two page worksheet contains sixty problems. Answers are included.
Curated OER
Mathemafish Population
It's shark week! In this problem, young mathematically minded marine biologists need to study the fish population by analyzing data over time. The emphasis is on understanding the average rate of change of the population and drawing...
EngageNY
Probability Distribution of a Discrete Random Variable
Learn how to analyze probability distributions. The sixth installment of a 21-part module teaches pupils to use probability distributions to determine the long-run behavior of a discrete random variable. They create graphs of probability...
Texas Instruments
Graphs of Rational Functions
Take your kids on a tour of graphing rational functions. Using this TI lesson plan, high schoolers identify the end behavior of their functions. They find the domain and range, describe end behavior, and look at asymptotes and...
Virginia Department of Education
Logarithmic Modeling
Explore logarithms and logarithmic regression. Young mathematicians first learn about inverse functions and about the logarithm function family. They take their newfound knowledge to use logarithmic functions to model situations and...
Curated OER
Graphical Analysis
Get out your TI-nspire graphing calculator and explore polynomials. Learners determine where a given polynomial are increasing or decreasing, find maximums, minimums, and zeros of polynomials, and discuss end behavior of polynomials....
Curated OER
Who am I? Find A Polynomial From Its Roots
High schoolers generate the equation of a polynomial given its roots and the end behavior of the function. They need to apply theorems concerning the multiplicity of roots, conjugates of irrational or imaginary roots to find a...
Curated OER
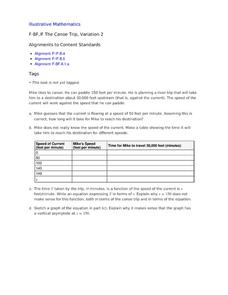
The Canoe Trip, Variation 2
The behavior of a rational function near a vertical asymptote is the focus around this trip up a river. Specifically, numerical and graphical understanding is studied. The canoe context pushes the variables as numbers, rather than as...
EngageNY
Exploring the Symmetry in Graphs of Quadratic Functions
Math is all about finding solutions and connections you didn't expect! Young mathematicians often first discover nonlinear patterns when graphing quadratic functions. The lesson begins with the vocabulary of a quadratic graph and uses...
EngageNY
Games of Chance and Expected Value 1
There's a strong chance that class members enjoy learning math through engaging games. Scholars analyze games of chance to determine long-term behavior. They learn to calculate expected value to help with this assessment.
Curated OER
Exploring Expressions
Examine parts of an expression in this algebra lesson. Ninth graders identify the properties of the coefficient and their behavior to the graph. They graph the equation on a TI to see their results.
PBS
Population Simulation with M&M's
Math and M&Ms® go great together when introducing a modeling activity. Allow your learners to simulate population growth and decay of fish in a pond and share their reasoning for the change in fish. With such an impact we have on our...


