Utah Education Network (UEN)
The Pasture and the Fence
Beginning geometers use tiles and grid paper to draw and calculate perimeter and area. Rectangles of different sizes are created and then measured to build understanding. The one-inch grid sheet referenced is attached.
Curated OER
Photosynthesis
Students conduct experiments with plants. In this photosynthesis lesson, students examine plants under different types of lights. They calculate the amount of dissolved ocygen concentration and compare it to the formula for...
Curated OER
How Credit Card Interest Works
Students experiment with an Excel spreadsheet model that demonstrates the effects of interest on payments. They calculate actual costs, interest paid, and time necessary to pay off credit purchases and draw conclusions about the...
Curated OER
Background Radiation and Lifestyles
In this radiation and lifestyles worksheet, students are given 5 problems about a person which indicate her exposure to radiation. Students calculate her total dosage to radiation in each problem based on her exposure.
Utah Education Network (UEN)
Subtracting Integers
Review the concepts of additive inverses and adding positive and negative integers. Relate understanding to the subtraction of integers. This is done with either the use of "Algeblocks" (any square or tile manipulative should do) or a...
Curated OER
Simple Inequalities
Students solve inequalities. In this inequalities lesson, students evaluate simple inequalities. They examine vocabulary words. Students participate in breath holding activities and write inequalities to represent the activity. In teams,...
Curated OER
Bouncing Ball : Function Families
A bouncing ball serves as more than entertainment when learning to apply quadratic functions to real-world events. This is the second of a two-part lesson, which can also be accessed from the website. The instructions say to measure the...
Curated OER
Influence and Outliers
Using the TI-Nspire calculator, statisicians identify outliers and their effect on the least-squares regression line. In finding the line of best fit, they determine what points will affect the least squares regressions and what points...
Curated OER
"Reviewing Facts Through 10" Lesson Plan
Explore the joy of math with you little learners! They practice creating math problems with numbers from a fact family using numbers 1-10. They work independently with a set of connecting cubes to aid them in creating number sentences...
Curated OER
Defining Division
Upper graders explore division through fair-shares. They will review fair shares and fractions as a segway into division. They start by playing "Share Fairly" game and create mathematical arguments for solving problems. Manipulatives and...
Curated OER
Tens! Hundreds! Thousands!!! of Tons
Fifth graders take a close look at the types of ships that travel through the Hudson River Valley on the Hudson River. They utilize worksheets embedded in the plan in order to answer questions about exactly what is being shipped, and how...
Illustrative Mathematics
Runners' World
Learners must investigate the validity of a claim made in a running magazine. They must identify and look up unprovided information, make appropriate estimations, and be able to convert units. Might be best used as a group or whole-class...
Curated OER
The Titanic 3
Can survival rates on the Titanic be explained by the "women and children first" policy or did rescue procedures favor the wealthy? Use actual historical data to explore conditional probability and independent events with your class....
Illustrative Mathematics
Stained Glass
A complex question looking for the total cost of a stained glass window by calculating area and circumference of a circle. With detailed components, this activity will challenge your designers to figure out if they have enough money to...
EngageNY
Complex Numbers and Transformations
Your learners combine their knowledge of real and imaginary numbers and matrices in an activity containing thirty lessons, two assessments (mid-module and end module), and their corresponding rubrics. Centered on complex numbers and...
Statistics Education Web
NFL Quarterback Salaries
Use statistics to decide if NFL quarterbacks earn their salaries! Learners study correlation coefficients after using technology to calculate regression equations. Through the data, they learn the meaning of correlation and correlation...
5280 Math
More or Less the Same
Tell the story of the math. Given a graph of a linear system, learners write a story that models the graph before crafting the corresponding functions. Graphs intersect at an estimated point, allowing for different variations in the...
Curated OER
Amelia the Pigeon: As a Pigeon Flies
Students follow Amelia's adventure on a satellite image. They use measuring and math skills to determine the distance she traveled.
Curated OER
Spooky Spiders-- Multiplication
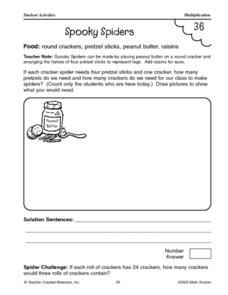
In this math/cooking instructional activity, students learn to multiply while figuring our how many of each ingredient for spooky spiders will be needed for a class cooking project. Students draw pictures and calculate amounts for the...
Curated OER
Weed killer
Is buying in bulk always better? In this real-world scenario, learners must decide which weed killer is the best bargain. Students work with units and percentages to calculate cost per fluid ounce.
Yummy Math
Curiosity Landed on Mars
Out of this world math and science are mixed together on a worksheet that would be a great enrichment activity classrooms that are studying our solar system. The information presented is best suited toward middle school math, and...
Yummy Math
Steep Hikes
Grab your hiking gear and get ready for a math adventure! Learners explore the meaning of percent grade change, as compared to the slope in an excellent worksheet activity about hiking trails in the mountains of New Hampshire. They use...
Shodor Education Foundation
Triangle Area
While the lesson focuses on right triangles, this activity offers a great way to practice the area of all triangles through an interactive webpage. The activity begins with the class taking a square paper and cutting in in half; can they...
EngageNY
Describing the Center of a Distribution
So the mean is not always the best center? By working through this exploratory activity, the class comes to realize that depending upon the shape of a distribution, different centers should be chosen. Learners continue to explore the...


