EngageNY
Multiplying and Dividing Rational Expressions
Five out of four people have trouble with fractions! After comparing simplifying fractions to simplifying rational expressions, pupils use the same principles to multiply and divide rational expressions.
EngageNY
Construct an Equilateral Triangle (part 1)
Drawing circles isn't the only thing compasses are good for. In this first installment of a 36-part series, high schoolers learn how to draw equilateral triangles by investigating real-world situations, such as finding the location of a...
Kenan Fellows
How Does an Unhealthy Diet Influence our Health and Well-Being?
You are what you eat, or so they say! After surveying family and friends on a week of eating habits, learners analyze the data for patterns. They compare different variables such as fats and cost, fats and calories, or fats and LDLs.
Education World
Putting Turkey on a Table (or a Graph)
Grateful learners put turkey on a table (or a graph)! Through a creative project they show statistical information about turkey population, production, and consumption. A great Thanksgiving lesson that can be applied at any time to the...
Curated OER
Measurement: 2D and 3D
Learners solve volume problems. In this geometry lesson, the class watches a video about clean water (link provided) and individuals compare the volume of different prisms, including an actual drinking glass. Extension activities include...
DK Publishing
3 More Than
Which one has three more? Young mathematicians compare three sets of objects to determine which has three more, checking it off. Then, they practice beginning addition skills by examining sets of candy and adding them up for a total....
Curated OER
Bar Graphs
Introduce scholars to bar graphs and data analysis through analyzing these visual examples. First, they look at a pictograph of fruit types and answer five observation questions. There is one done for them as an example. Learners do the...
Mathematics Assessment Project
Taxi Cabs
A simple real-world problem involving taxi cab fares is used to practice the multplicaiton and division of integers. How many of two different-sized taxis are needed to transport 75 people to the airport? What is the least...
Illustrative Mathematics
Triangular Tables
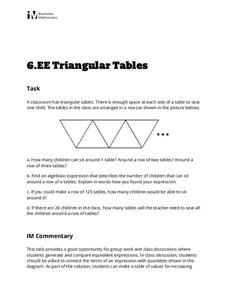
Somewhat of a puzzle, this problem gets pre-algebra preteens to write an expression representing a seating chart using triangle-shaped tables. This single task is an applicable lesson for meeting sixth grade Common Core math standards....
Illustrative Mathematics
6.EE.4 Equivalent Expressions
Straight to the point, learners are asked to compare a set of five expressions, determine which are equivalent, and then write equivalent equations for those that do not have any. A benefit is that they will review using properties...
Illustrative Mathematics
Representing Half of a Circle
Geometric shapes make great visual models for introducing young mathematicians to the concept of fractions. Looking at a series of four circles, students are asked to determine whether or not one half of each circle is shaded. To support...
Balanced Assessment
Disc-Ness
Transform your scholars into mathematicians as they develop their own geometric definition. The task asks individuals to compare cylindrical objects and create a definition for the disc-ness of each object. They may use any method and...
5280 Math
More or Less the Same
Tell the story of the math. Given a graph of a linear system, learners write a story that models the graph before crafting the corresponding functions. Graphs intersect at an estimated point, allowing for different variations in the...
Alabama Learning Exchange
Sky High
How are skyscrapers built? What does it take to make a structurally sound building? How can one work within a budget to complete a building project? These guiding questions will be investigated and answered within a hands-on lesson...
Curated OER
The Value of Education
The real value of education is highlighted in more than one way on a instructional activity designed to not only add, subtract, multiply, and divide decimals to hundredths, but also to address the correlation between...
Illustrative Mathematics
Grass Seedlings
Plants never grow at the same rate, and that is the antithesis for this word problem involving multiplication of fractions. On the instructional activity, Raul notices that Pablo's seedlings are 1 1/2 times as tall, and Celina's...
Illustrative Mathematics
The Escalator, Assessment Variation
A great way to practice with unit rates, the activity gives your mathematicians an opportunity to compare different statements and select which are true. They can practice with "choose all that apply" by setting each statement into its...
Illustrative Mathematics
Riding at a Constant Speed, Assessment Variation
Practice ratios and unit rates with tracking how long Lin took to ride her bike. Provided with different questions, your mathematicians can assemble their answers using a chart or setting up ratios. The activity is included in a set of...
Curated OER
Activity: An Experiment with Dice
Roll the dice with this activity and teach young mathematicians about probability. Record outcomes for rolling two number cubes in order to determine what is most likely to happen. Graph the data and investigate patterns in the results,...
Curated OER
Seeing Dots
Your algebra learners interpret algebraic expressions, in order to compare their structures, using a geometric context. They also discern how the two expressions are equivalent and represent a pattern geometrically and algebraically.
Statistics Education Web
Who Sends the Most Text Messages?
The way you use statistics can tell different stories about the same set of data. Here, learners use sets of data to determine which person sends the most text messages. They use random sampling to collect their data and calculate a...
Teach Engineering
Build the Biggest Box
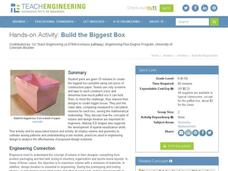
Boxing takes on a whole new meaning! The second installment of the three-part series has groups create lidless boxes from construction paper that can hold the most rice. After testing out their constructions, they build a new box....
Illustrative Mathematics
Valid Equalities?
True or false: 20 = 10 + 10. The statement is true because two 10s make a 20. These are the types of equations learners must label or false. They must also explain in mathematical terms how they know.
101 Questions
Binder Clips: Large, Medium, Small
Ever wondered how many pieces of paper a binder clip can hold? Viewers of a short video are about to find out! Given measurement data for three different sized binder clips, learners must develop a method for figuring out how many pieces...


