It's About Time
How Do Carbon Dioxide Concentrations in the Atmosphere Affect Global Climate?
Does carbon dioxide really affect temperatures across the world? This fifth installment in a six-part series investigates the relationship between carbon dioxide and global temperatures. Graphs created from genuine data help...
EngageNY
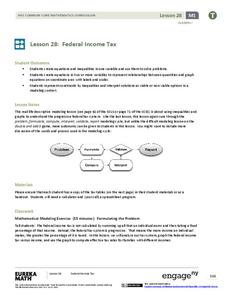
Federal Income Tax
Introduce your class to the federal tax system through an algebraic lens. This resource asks pupils to examine the variable structure of the tax system based on income. Young accountants use equations, expressions, and inequalities to...
Curated OER
Data Collection and Presentation
Middle and high schoolers collect and analyze data from four different activities. The activities include information about classmates, tallying colors of cars in a parking lot, stem and leaf plots, and making a histogram from...
Balanced Assessment
Para-Ball-A
Analyze the flight of a thrown ball. Learners determine the maximum height of a thrown ball and the time it takes to hit the ground given its initial speed. They continue to review different scenarios with different maximums or...
Curated OER
Creating a Thematic Map
Students create and analyze a weather-related data table and a thematic map based upon information provided.
Mathematics Assessment Project
Sugar Prices
Sugar rush! In this assessment task, learners interpret points on a scatter plot representing price versus weight for bags of sugar. They then determine the bag that represents the best value.
Shodor Education Foundation
Two Variable Function Pump
Use a function to operate on two variables. Pupils look at operating with complex numbers as a function of two variables. The interactive squares the input and adds a constant to it. Learners visualize the resulting output and its...
EngageNY
Secant and the Co-Functions
Turn your class upside down as they explore the reciprocal functions. Scholars use the unit circle to develop the definition of the secant and cosecant functions. They analyze the domain, range, and end behavior of each function.
Teach Engineering
Can You Resist This?
Some things are hard to resist. Small collaborative groups build circuits and calculate the voltage using Ohm's Law. Budding engineers explore the connection between the voltage across different resistors and linear...
Shodor Education Foundation
Simple Maze Game
Avoid the mines and win the game! Young scholars direct a robot through a minefield by plotting points. Their goal is to reach the target in as few moves as possible.
Utah Education Network (UEN)
Geometry
Shape one's understanding of geometry using the resource. The sixth of seven chapters in 6th Grade Math focuses on geometry principles. Future mathematicians learn to find the area of parallelograms, trapezoids, triangles, and other...
Curated OER
Linear Inequalities in One and Two Variables: Rays and Half Planes
Define rays and half planes, including the concepts of boundary lines and prerequisite knowledge of coordinate planes. Given linear inequalities in one and two variables, your class will compare the differences. They will also graph...
Illustrative Mathematics
Equations of Lines
The intent of this resource is to show algebra learners that there is a proportional relationship between two lines that have an intersecting point. As the coordinate x increases by a constant, the y coordinate also increases. It...
Illustrative Mathematics
Two Lines
Here is a resource that helps your algebra learners understand the connection between the graph of two lines, the equations of lines, and the solutions and intersecting points of lines. It would make a great assessment question, but can...
Curated OER
Investigation-Looking at Polygons
Eighth graders plot points and investigate polygons. They locate a point, using ordered pairs of integers on the coordinate plane. Students compare geometric measurements and computations on coordinate axes as they are applied to...
Curated OER
Geometric Figures-Triangles
Fourth graders explore triangles. In this math instructional activity, 4th graders discuss the different types of triangles. Students create triangles using wiki sticks. Students complete an online matching game.
Curated OER
Plugging Into The Best Price
Examine data and graph solutions on a coordinate plane with this algebra lesson. Young problem-solvers identify the effect of the slope on the steepness of the line. They use the TI to graph and analyze linear equations.
Curated OER
What's Your Shoe Size? Linear Regression with MS Excel
Learners collect and analyze data. In this statistics activity, pupils create a liner model of their data and analyze it using central tendencies. They find the linear regression using a spreadsheet.
Math Worksheets 4 Kids
Point of Intersection Worksheet 2
Math wizards rewrite pairs of linear equations in the y-intercept form and graph them on a coordinate plane. They identify where the lines cross, i.e. the point of intersection. There are four questions with coordinate planes for drawing...
Curated OER
Lines, Lines, Everywhere
Students explore linear equation suing real life scenarios. In this algebra lesson, students find the slope and intercept of a line. They create table of values to plot their graph and draw conclusions.
Illustrative Mathematics
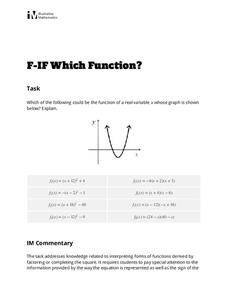
Which Function?
Learners are given a graph of a parabola on a coordinate system, but intercepts and vertex are not labeled. The task is to analyze eight given quadratic functions and determine which ones might possibly be represented by the graph. The...
Curated OER
Domain and Range
In this domain and range worksheet, students write the definitions for relation, function, domain and range. They then find the domain and range of 7 sets of ordered pairs. Finally, students answer 4 questions regarding inverse relations...
Curated OER
Interactivate - Lines, Rays, Line Segments, and Planes
Students explore lines, rays, line segments, and planes. In this math lesson, students discuss the math concepts and direct their instructor in graphing functions. Students collaborate in graphing additional functions.
Curated OER
Representation of Quadratic Functions
Young scholars use a table, graph or equation to represent a quadratic function. In this algebra lesson, students model and graph with quadratic function. They become comfortable representing quadratics using different...


