West Contra Costa Unified School District
Comparing Data Displays
There is so much more to data than just numbers, and this resource has learners use three methods of comparing data in a multi-faceted instructional activity. The 21-page packet includes a warm-up, examples, an activity, and...
CK-12 Foundation
Displaying Categorical Variables: Spending Habits
Bar or circle graph—which is best? Given a circle graph and a total amount of money earned, pupils calculate the amount of money in each category. Learners use the calculated amounts to create a bar graph and compare the two displays.
CK-12 Foundation
Displaying Univariate Data: Ordering Leaves
Leaf a little time to organize data. Given data displayed in a stem-and-leaf plot, learners organize the data in a list. Pupils use the data to determine the mode, median, and range of the data set. They determine the benefits of using a...
Curated OER
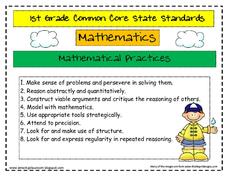
Common Core State Standards 1st Grade Math
Here are the complete set of the math practice standards and the Common Core standards for first grade. They cover operations & algebraic thinking, operations in base 10, measurement and data, and geometry. Illustrated nicely with...
EngageNY
Describing a Distribution Displayed in a Histogram
The shape of the histogram is also relative. Learners calculate relative frequencies from frequency tables and create relative frequency histograms. The scholars compare the histograms made from frequencies to those made from relative...
Del Mar College
Divisibility Rules
There's a lot to remember when it comes to math concepts. Help scholars get a head-start to learning division with a reference page offering divisibility rules for the numbers two, three, four, five, six, eight, nine, and 10.
Curated OER
Fish Math
Students recognize things that are the same and things that are different. They use shape, size, numbers and color, for recognition. They make fish with different shapes/colors on them and 'fish' for the kind of fish that displays the...
Curriculum Corner
“I Can” Common Core! 1st Grade Math
Any first grader can master the Common Core math standards with this checklist! With each standard rewritten as an affirmative I can statement, children are provide with clear goals to work toward throughout the school...
Curated OER
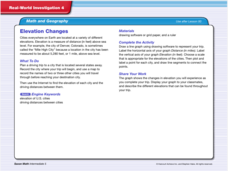
Real World Investigation- Math and Geography- Elevation Changes
In this math and geography real world investigation, 6th graders plan a driving trip to a city that is located several states away from their home while recording the elevations of three cities that are included in the trip. They use...
Math Solutions
Dr. Seuss Comes to Middle School Math Class
If you think Dr. Seuss has no place in a math classroom, then take a look at this resource. Based on the classic children's book Green Eggs and Ham, this sequence of activities engages children learning to model real-world contexts...
Curated OER
Flicking Football Fun
Young mathematicians fold and flick their way to a deeper understanding of statistics with a fun, hands-on math unit. Over the course of four lessons, students use paper footballs to generate data as they learn how to create line...
101 Questions
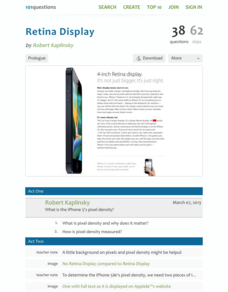
Retina Display
Learners calculate the pixel density of a specific cell phone using the concept of similarity. They use information from the cell phone's website to make their calculations and then compare their results to the posted information.
CK-12 Foundation
Frequency Tables to Organize and Display Data: Favorite Films
What information can your class determine if they know the number of people attending movie showings? Using the information about the number of people at each screening, learners develop a frequency table. The pupils analyze the type of...
CCSS Math Activities
Smarter Balanced Sample Items: 6th Grade Math – Target J
What is the best measure of central tendency? Scholars explore mean, median, mode, range, and interquartile range to understand the similarities and differences. They display data in dot plots, histograms, box plots, and more as part of...
Curated OER
Choose a Graph to Display Data
In this math graphs worksheet, learners write line plot, tally chart, pictograph, or bar graph to tell the best kind of graph to use to answer the six questions.
CCSS Math Activities
Smarter Balanced Sample Items: High School Math – Target C
Let units pave the way to success. A set of five questions in a helpful PowerPoint presentation highlights the SBAC Claim 1 Target C high school item specifications. It covers the use of units to steer solutions, identifying appropriate...
Balanced Assessment
Oil Consumption
An assessment presents a chart displaying oil consumption Pupils use the chart to determine the greatest increase in consumption, and then apply that information to figure out when the consumption may reach 100 million barrels a day.
Jude Mphoweh
Graphs
Searching for worksheets to include in an elementary math series on bar graphs? Then look no further! This collection of materials has exactly what you need to ensure that your students get plenty of practice reading and analyzing...
Mathed Up!
Stem and Leaf Diagrams
Order the data within a stem-and-leaf display. Pupils take data and create and ordered stem-and-leaf diagrams, including the key. Participants take their data and determine answers about the information. Class members then find...
CK-12 Foundation
Double Bar Graphs: Favorite Cookies Chart
It's just the way the cookie crumbles. Using the data from a class poll, learners create a double bar graph showing favorite cookie types. The pupils compare favorites between boys and girls with the aid of their graphs, then they make...
CK-12 Foundation
Understand and Create Histograms: Car Sales
Create a history of car sales. Pupils create a histogram/bar graph to show the number of car sales made during the week. Using the data display, learners calculate numerical summaries of the data and find the percent of cars sold during...
Radford University
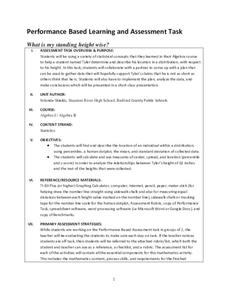
What is My Standing Height Wise?
Given a scenario in which a class member wants to prove his height is not an outlier, pairs devise a plan and gather evidence to help support his claim. The small groups implement their plans and create graphical displays of their data...
Bowland
Tuck Shop
Correct a misleading conclusion. Individuals review a set of data and a conclusion to determine what is wrong with the conclusion. Pupils then represent the data with an appropriate display. Finally, learners develop a correct conclusion...
Curriculum Corner
7th Grade Math "I Can" Statement Posters
Translate the Common Core math standards into a series of achievable "I can" statements with this collection of classroom displays. Offering posters for each standard, this resource is a great way to support your seventh graders as...


