Shodor Education Foundation
Experimental Probability
Spin into a dicey experiment. Pupils use a spinner or a pair of dice to determine the experimental probabilities of each outcome. The interactive allows for either, one, five, or ten consecutive experiments. Using the applet, learners...
Shodor Education Foundation
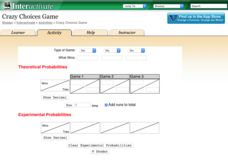
Crazy Choices Game
Wanna take a chance on which game is best? The resource provides three games of chance using multiple types of games. Games range from coin toss to cards. Choosing a type of game, pupils determine what wins and enter the theoretical...
Shodor Education Foundation
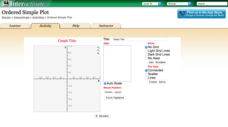
Ordered Simple Plot
Open your imagination to make algebra-inspired creations. An interactive lesson has scholars graph images from a set of parameters. Users can practice minimum values, maximum values, and scale as well as key features.
Shodor Education Foundation
Algebra Quiz
Reviewing the process of solving equations is as easy as one click of a button. Scholars solve linear and quadratic equations by using a helpful interactive. The computer app automatically scores responses, providing immediate feedback...
Shodor Education Foundation
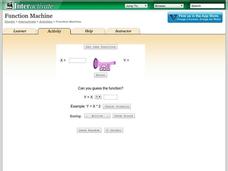
Function Machine
Machines can be so helpful sometimes. A simple interactive has learners enter input values for a function machine and observe output values. These values help determine a function that represents the input-output relationship in the...
Shodor Education Foundation
Conic Flyer
Graphing conics made easy. Individuals use an interactive to graph conic sections. The app can handle circles, vertical and horizontal parabolas, ellipses, and vertical and horizontal hyperbolas.
Shodor Education Foundation
Linear Inequalities
An interactive lesson helps individuals learn to graph inequalities in two variables. Scholars can adjust the interactive to present the inequalities in standard or slope-intercept form.
Shodor Education Foundation
Rabbits and Wolves
A change in a parameter can end in overpopulation. The resources gives pupils the opportunity to control the parameters of rabbits and wolves in a natural setting. Using the set parameters, the simulation runs and displays the population...
Shodor Education Foundation
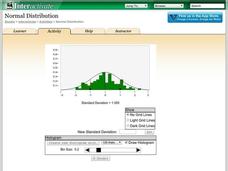
Normal Distribution
Does the size of the bin matter? The resource allows pupils to explore the relationship between the normal curve and histograms. Learners view histograms compared to a normal curve with a set standard deviation. Using the interactive,...
Shodor Education Foundation
Multi-Function Data Flyer
Explore different types of functions using an interactive lesson. Learners enter functions and view the accompanying graphs. They can choose to show key features or adjust the scale of the graph.
Shodor Education Foundation
Multiple Linear Regression
You'll have no regrets when you use the perfect lesson to teach regression! An interactive resource has individuals manipulate the slope and y-intercept of a line to match a set of data. Learners practice data sets with both positive and...
Curated OER
Double Dare Addition!
Students apply basic number concepts and computation skills while engaging in an enriching group activity. Then they demonstrate their knowledge of addition using a medium that enables everyone to show their solutions for immediate...
Curated OER
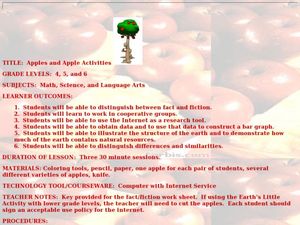
Apples and Apple Activities
Students investigate apples. In this reading comprehension lesson, students read a book about apples then compare and contrast, make graphs, distinguish between fact and fiction and work in groups. Students work in groups to search the...
Curated OER
A Picture is Worth a Thousand Words: Introduction to Graphing
Students practice graphing activities. In this graphing lesson, students discuss ways to collect data and complete survey activities. Students visit a table and graphs website and then a create a graph website to practice graphing.
Curated OER
There's No Accounting for Good Journals
Tenth graders create journals on their spending habits. In this money-management lesson plan, 10th graders create and keep journals of their personal income and expenditures. Students learn to use Excel to create a spreadsheet for their...
Curated OER
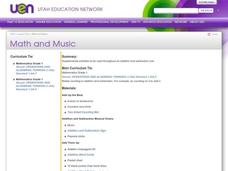
Math and Music
First graders play a variety of learning games to reinforce addition and subtraction skills.
National Center for Families Learning
The Summer Fun Summer Learning Dance Unit
Summer slide. Alas, not a term synonymous with a type of sliding board, summer slide refers to the fact that learning slips during summer break, especially in the areas of spelling and math facts. Enrich summer break with a...
National Center for Families Learning
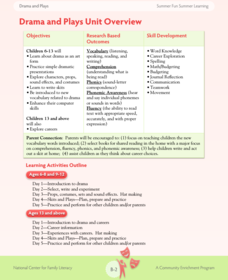
The Summer Fun Summer Learning Drama and Plays Unit
The play's the thing that puts the play in a summer learning drama program designed to combat summer slide and encourage family literacy. Participants learn about drama as an art form, engage in dramatic presentations, write scripts, and...
Curated OER
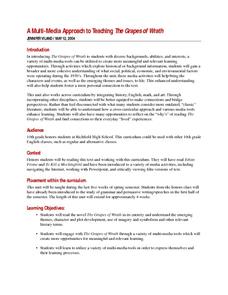
A Multi-Media Approach to Teaching The Grapes of Wrath
Integrate history, math, and art into a study of The Grapes of Wrath with a series of activities that ask learners to investigate the social, political, economic, and environmental factors at play during the 1930s. Designed to be used...
Curated OER
Interpreting Graphs
Sixth graders interpret linear and nonlinear graphs. They create graphs based on a problem set. Next, they represent quantitive relationships on a graph and write a story related to graphing.
Curated OER
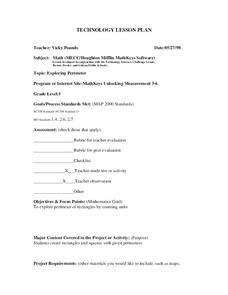
Exploring Perimeter
Learners explore perimeter. In this geometry and measurement lesson plan, students create squares and rectangles using given perimeters. Learners construct four sided shapes with given perimeters using the computer program "Math Keys:...
Curated OER
Area And Perimeter Using Pentominoes
Third graders engage in an enrichment lesson exploring the concepts of area and perimeter. They construct new pentominoes that are 3 times the size of normal ones and then identify the area and perimeter measurements. They then create a...
Curated OER
Origami Ducks: Geometry, Listening, and Following Directions
Make origami ducks with your class to reinforce geometry concepts and vocabulary; develop fine motor and visual translation skills; and enrich study of Japanese culture, the pond habitat, or migration. Create a whole group "worksheet"...
Curated OER
Representing Constraints
What are constraints and how can they be represented mathematically? This instructional slideshow provides an explanation and an example of how to translate constraints into algebraic inequalities.


