Curated OER
Continuity
Students examine graphs to determine if they are continuous at a given point. In this examining graphs to determine if they are continuous at a given point instructional activity, students examine various graphs. Students determine...
Curated OER
Patterns, Relations, and Functions: Lesson 3: Numerical Patterns
Fourth graders extend and continue numerical patterns using function or input/output machines. They finish the increasing patterns using input/output tables, and generalize the rules that apply to the pattern. They complete the...
Curated OER
Patterns, Relations And Functions
Fourth graders observe patterns and determine a mathematical function that creates the pattern. Through a demonstration by the teacher, they observe strategies such as multiplication, division, addition, and subtraction to use when...
Curated OER
Transformations of Functions 1
Learn how to solve problems with transformation. Students perform transformation on their graphs. Then, they use the TI to create a visual of the graph as it is moving along the graph.
Curated OER
Dead Body Math
Students solve the mystery of dead Mr. Potato Head using physics and algebra. They discuss Newton's Law of cooling as it applies to the mystery scenario involving a cooling baked potato as the "victim". They manipulate algebraic...
Curated OER
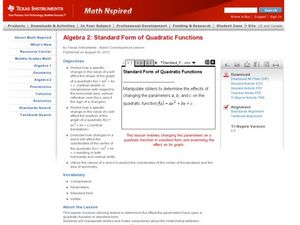
Standard Form of Quadratic Functions
Students factor quadratic equations. In this algebra lesson, students identify the factors and use them to graph the parabola. They find the parameters and vertex of each graph.
Texas Instruments
Math TODAY for TI-Navigator System - Is Leisure Time Really Shrinking?
High schoolers organize data from the USA TODAY Snapshot, "Is leisure time really shrinking?" into two scatter plots and determine the quadratic model for each scatter plot. They determine if these graphs intersect and learn the concept...
Curated OER
Using Tables to Solve Linear Functions
Oh that intercept! Budding algebra masters solve linear equations from standard to intercept form. They identify the slope and y-intercept to help graph the lines, an then create coordinate pairs using a table of values. Great TI tips...
Curated OER
Patterns and Functions
Learners investigate properties of perimeter and area. In this middle school mathematics lesson, students explore patterns in a problem solving context. Learners model and solve problems using various representations for the data as they...
Curated OER
Food Math
Fourth graders explore healthy habits by completing caloric measurement activities. In this food choice lesson plan, 4th graders discuss what types of foods give you protein or fat and utilize a food chart to measure caloric intake....
Curated OER
Functions of Algebra
Students use technology graph and evaluate linear inequalities. They write and manipulate inequalities for use on a graphing calculator. In addition they apply their skills to analyze inequalities. Answer Key included.
Curated OER
2D Grpahing Functions
In this algebra worksheet, 9th graders graph linear equations using a line. They find values for x and y and plot them on a coordinate plane to make a line. There are 6 questions.
Curated OER
e, pi, and Exponential Functions
Students investigate e, pi and exponents. In this calculus instructional activity, students define constants and non-constants using, pi, e and exponents as an example. They use the TI to work the problems in this instructional activity.
Curated OER
Math B Regents Questions by Performance Indicator: Logarithms
In this logarithms worksheet, students solve logarithm equations. They read story problems and find equivalent expressions to given logarithms. This three-page worksheet contains 13 problems. Answers are provided on the last page.
Curated OER
Math: Currency Exchange Rates
Sixth graders apply the division and multiplication of decimals to convert dollars to various international currencies. In a travel simulation activity, they convert money, distance, and temperatures. During their "trip," students...
EngageNY
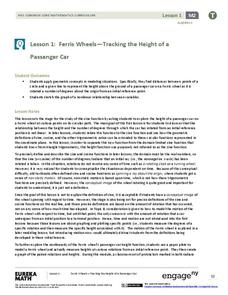
Ferris Wheels—Tracking the Height of a Passenger Car
Watch your pupils go round and round as they explore periodic behavior. Learners graph the height of a Ferris wheel over time. They repeat the process with Ferris wheels of different diameters.
EngageNY
Modeling a Context from Data (part 1)
While creating models from data, pupils make decisions about precision. Exercises are provided that require linear, quadratic, or exponential models based upon the desired precision.
EngageNY
Graphing Factored Polynomials
Young mathematicians graph polynomials using the factored form. As they apply all positive leading coefficients, pupils demonstrate the relationship between the factors and the zeros of the graph.
EngageNY
Linear and Exponential Models—Comparing Growth Rates
Does a linear or exponential model fit the data better? Guide your class through an exploration to answer this question. Pupils create an exponential and linear model for a data set and draw conclusions, based on predictions and the...
EngageNY
Newton’s Law of Cooling, Revisited
Does Newton's Law of Cooling have anything to do with apples? Scholars apply Newton's Law of Cooling to solve problems in the 29th installment of a 35-part module. Now that they have knowledge of logarithms, they can determine the decay...
EngageNY
Modeling from a Sequence
Building upon previous knowledge of sequences, collaborative pairs analyze sequences to determine the type and to make predictions of future terms. The exercises build through arithmetic and geometric sequences before introducing...
Curated OER
Exploring Quadratic Data with Transformation Graphing
Using a data collection device to collect data regarding a bouncing ball, students use various features on graphing calculators to experiment with the parameters of the vertex form of the parabola and their effect on the shape of the...
Curated OER
Reading Graphs
Working independently or in teams, your class practices connecting graphs, formulas and words. This lesson includes a guided discussion about distance vs. time graphs and looking at how velocity changes over time.
EngageNY
Modeling an Invasive Species Population
Context makes everything better! Groups use real data to create models and make predictions. Classmates compare an exponential model to a linear model, then consider the real-life implications.
Other popular searches
- Math Functions Quadratic
- Math Functions Domain Range
- In/out Math Functions
- Math Functions and Patterns
- Math Functions Egg Carton
- Math Functions Spaghetti
- Math Functions Bridge
- Math Functions Rounding
- Composite of Math Functions
- Math Functions Quadractic
- Functions Math
- Linear Functions Math Models


