Curated OER
Inverse Trigonometry
In this math learning exercise, students graph each function while focusing upon finding the domain and range of each one. They also find the exact values using sine, cosine, and tangent.
Curated OER
Quadratics Introduction
Students investigate quadratic functions graphically and algebraically.
Curated OER
Lining Up Data
Students examine the concept of function and make models of data and predictions based on that data.
Curated OER
Lesson Plan On Fran Data
Seventh graders investigate the concept of functions and how they are used in the context of the real world while identifying the dependent and independent variables. They graph relations and functions and find the zeros of functions....
Curated OER
Minimum and Maximum of a Graph
Students find the solutions of polynomials through graphing. In this algebra lesson, students identify the maximum and minimum of each polynomial function. They ind the vertex, domain and range of a parabola.
Curated OER
Review Problems
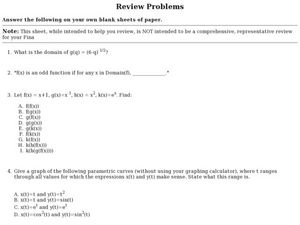
In this algebra worksheet, students identify functions using the domain and range. They use correct function notation to solve composition functions. There are 13 questions.
Curated OER
The Box Problem
Pupils create graphic, algebraic and verbal ideas of functions. In this algebra lesson, students graph functions and identify the zeros of the functions. They find the domain and range and classify functions as relation or not.
Curated OER
Sinusoidal modelling of Canad'a youth cohorts
Students explore the general form of the sine equation. In this trigonometry instructional activity, students explore the relationship between the changing parameters and the graph of the sine equation. Students use data and a...
Curated OER
Graphing Linear Equations - With Table
Learners describe relations and graph linear functions. After studying a geometric shape and a verbal statement, students contrast the differences between the verbal statement and the picture. They determine functions and graph...
Curated OER
Price of Apples- Linear Data
Young scholars collect data and create a graph. In this algebra lesson, students describe functions graphically, algebraically and verbally. They identify functions as being independent and dependent using variables.
Curated OER
A.P. Calculus Prerequisite No Calculator Multiple-Choice and Free-Response Exam
In this A.P. Calculus pre-requisites worksheet, students solve ten multiple-choice and ten free-response questions. Many of these questions cover trigonometric functions.
Curated OER
AP Calculus Exam
In this calculus worksheet, students review important rules of derivatives and integrations. They graph their functions using symmetry and coordinate pairs. There are 20 questions.
Curated OER
Simplifying Rational Expressions
For this algebra worksheet, students identify the properties of rational expressions. They find the domain and range. There are 5 questions with an answer key.
Curated OER
Input- Output Tables
In this multi-use input-output table instructional activity, students fill in 20 tables to determine the rule for a math sequence or pattern. There are no directions given with this instructional activity.
Curated OER
Simplifying Expressions
In this simplifying expressions instructional activity, students solve and complete 41 various types of problems. First, they simplify each expression and write using exponents. Then, students graph each function and state the domain and...
Curated OER
Rational Expressions
In this algebra worksheet, students factor rational expressions. They identify the domain and range of each function. There are 47 questions.
Curated OER
Limits
Pupils analyze data algebraically. In this calculus lesson, students determine the limit based on the 3 properties of limits. They identify the domain and range of each function.
Curated OER
Whose Line is it Anyway?
Students solve systems of equations. In this algebra lesson, students identify the domain and range of each function. They use the slope and y-intercept to graph each line.
Radford University
A Change in the Weather
Explore the power of mathematics through this two-week statistics unit. Pupils learn about several climate-related issues and complete surveys that communicate their perceptions. They graph both univariate and bivariate data and use...
EngageNY
What Is a Trigonometric Identity?
Protect yourself from identity theft! Establishing a strong understanding of the Pythagorean identity allows learners to prove that sine^2x + cos^2x = 1. They then use the identity to find sine or cosine ratios given the other.
Radford University
Sleep and Teen Obesity: Is there a Correlation?
Does the number of calories you eat affect the total time you sleep? Young mathematicians tackle this question by collecting their own data and making comparisons between others in the class through building scatter plots and regression...
Concord Consortium
In a Triangle
What's in a triangle? Just 180 degrees worth of angles! Young learners use given angle relationships in a triangle to write an algebraic representation. Using a system of equations, they simplify the equation to a linear representation.
King County
Reproductive System
It's every health and science teacher's favorite subject to cover: the reproductive system. This comprehensive lesson introduces adolescents to the reproductive anatomy of men and women with the help of a series of diagrams, discussions,...
Curated OER
Graphing Inequalities in Two Variables
This study guide is a great resource to help you present the steps to graphing linear inequalities. Show your class two different ways to graph an inequality and work on a real-world example together. The document could also be easily...


