EngageNY
Interpreting Quadratic Functions from Graphs and Tables
Seeing functions in nature is a beautiful part of mathematics by analyzing the motion of a dolphin over time. Then take a look at the value of a stock and maximize the profit of a new toy. Explore the application of quadratics by...
Mathematics Vision Project
Module 1: Functions and Their Inverses
Undo a function to create a new one. The inverse of a function does just that. An inquiry-based lesson examines the result of reversing the variables of a function, beginning with linear patterns and advancing to quadratic and...
CCSS Math Activities
Smarter Balanced Sample Items: High School Math – Target L
Functions are for forming context models. A PowerPoint file contains 11 questions for learners to answer. It covers the high school SBAC Claim 1 Target L item specifications and requires interpreting functions, determining appropriate...
Saxon
Plotting Functions
Youngsters use a graphing calculator to assist in creating a function table. They graph the function on a coordinate plane. They explore the relationship between the domain and range in the graph. This four-page activity contains two...
Illustrative Mathematics
Identifying Graphs of Functions
Match the graph with its function in an exercise that focuses on variations of the graph of y = e^x. Learners are given four graphs on the same set of axes and four functions, all involving e^x. The task is to match each...
Math Wire
Function Machine
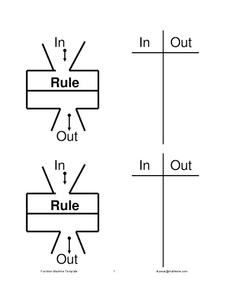
Provide your mathematicians with a way to organize their algebraic functions with this function machine handout. Each sheet provides a place to write down the rule and then either a t-table or full table to organize their input and output.
CCSS Math Activities
Smarter Balanced Sample Items: 8th Grade Math – Claim 4
A math model is a good model. A slide show presents 10 sample items on modeling and data analysis. Items from Smarter Balanced illustrate different ways that Claim 4 may be assessed on the 8th grade math assessment. The presentation is...
Illustrative Mathematics
Invertible or Not?
Two for one—create an invertible and non-invertible function from the same data. The task presents a function table with missing outputs for the class to use to create two functions. One of the functions should have an inverse while the...
Curated OER
Linear and Exponential Functions
This comprehensive unit on linear and exponential functions provides numerous clearly-written worksheets. Topics include graphing linear equations, solving systems of equations algebraically and by graphing, identifying the domain and...
Houston Area Calculus Teachers
Polynomial Graphing
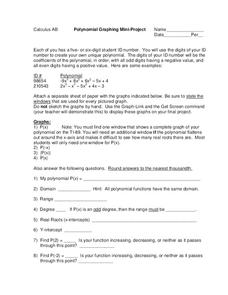
Your AP Calculus learners probably have their ID numbers memorized, but have they tried graphing them? Pique your pupils' interest by asking each to create a unique polynomial function based on their ID numbers, and then analyze the...
EngageNY
Extending the Domain of Sine and Cosine to All Real Numbers
Round and round we go! Pupils use reference angles to evaluate common sine and cosine values of angles greater than 360 degrees. Once they have mastered the reference angle, learners repeat the process with negative angles.
Howard County Schools
Drawing Inverses
An Algebra II lesson draws the connection between the exponential function and its inverse. By graphing an exponential function and using tables and a calculator, students graph the logarithmic function. The plan comes with a...
Teach Engineering
Club Function
Let's get the herd to follow the rules. The activity associated with the second lesson in the unit introduces the class to the definition of a function. Individuals must gather in groups of zebras and rhinos defined by the general...
Curated OER
Relations and Functions
For this relations and functions worksheet, 11th graders solve and complete 10 various types of multiple choice problems. First, they use the same relation between two variables as the given table to determine the value of one variable...
Curated OER
Operations on Functions
In this operations and functions learning exercise, students add, subtract, multiply, and divide functions. This one-page learning exercise contains 18 multi-step problems.
Curated OER
Graphs and Transformations of Functions
Is it possible to solve quadratic equations by factoring? It is, and your class will graph quadratic equation and functions too. They perform transformation on their graphs showing increasing and decreasing intervals, domain, and range....
Curated OER
Exponential Functions
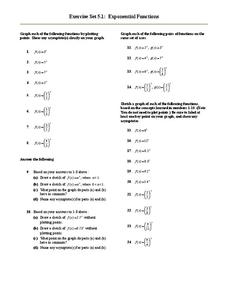
With this two-page resource, learners evaluate and graph exponential functions. There are 48 questions using logs and exponents as the parent function.
Illustrative Mathematics
Oakland Coliseum
Help algebra learners relate a real-life function that happens at the Oakland Coliseum every time the Raiders play. The resource states that the revenue of the Oakland Raiders home games is a function of the number of seats sold and the...
Curated OER
Profitable Soda Stand
Am I making any money? Help learners determine if their fictitious soda stand is turning a profit. They graph linear equations using the slope and y-intercept and identify the best price to use to sell soda. They identify the domain and...
Flipped Math
Unit 7 Review: Exponential Functions
Take a break from learning new information and take time to review. Scholars review the unit by completing some practice problems. They rewrite expressions using exponents, solve exponential equations, graph exponential functions,...
Curated OER
Finding Domain and Range
In this domain and range worksheet, students observe a graph and identify the domain and range of given functions. Afterwards, they solve functions to identify the range. Fifteen problems are provided on this one-page worksheet.
Curated OER
Pedal Power
Employ proportional reasoning and algebraic understanding to a determine a real world math quandary. Intel has created a project based unit to engage learners in using algebra to describe the physical world. They will create equations,...
Curated OER
Worksheet 4, Functions
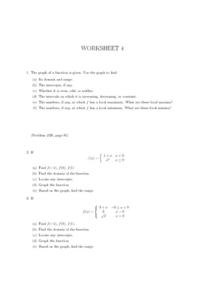
Eighth and ninth graders graph a given function and identify the domain, range and intercepts. Theytell the intervals that the function is increasing, decreasing, or constant. Pupils identify the minimum and maximum of the graph, and...
Curated OER
Graphs
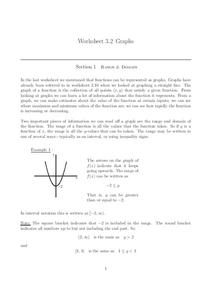
In this graphs worksheet, students solve and complete 15 various types of problems. First, they determine the range of the function of the graph shown and write in interval notation. Then, students find the domain of the function in the...


