Curated OER
Minimum and Maximum of a Graph
Students find the solutions of polynomials through graphing. In this algebra lesson, students identify the maximum and minimum of each polynomial function. They ind the vertex, domain and range of a parabola.
Curated OER
The Box Problem
Pupils create graphic, algebraic and verbal ideas of functions. In this algebra lesson, students graph functions and identify the zeros of the functions. They find the domain and range and classify functions as relation or not.
Curated OER
Sinusoidal modelling of Canad'a youth cohorts
Students explore the general form of the sine equation. In this trigonometry instructional activity, students explore the relationship between the changing parameters and the graph of the sine equation. Students use data and a...
Curated OER
Graphing Linear Equations - With Table
Learners describe relations and graph linear functions. After studying a geometric shape and a verbal statement, students contrast the differences between the verbal statement and the picture. They determine functions and graph...
Curated OER
Price of Apples- Linear Data
Young scholars collect data and create a graph. In this algebra lesson, students describe functions graphically, algebraically and verbally. They identify functions as being independent and dependent using variables.
Curated OER
Limits
Pupils analyze data algebraically. In this calculus lesson, students determine the limit based on the 3 properties of limits. They identify the domain and range of each function.
Curated OER
Whose Line is it Anyway?
Students solve systems of equations. In this algebra lesson, students identify the domain and range of each function. They use the slope and y-intercept to graph each line.
EngageNY
What Is a Trigonometric Identity?
Protect yourself from identity theft! Establishing a strong understanding of the Pythagorean identity allows learners to prove that sine^2x + cos^2x = 1. They then use the identity to find sine or cosine ratios given the other.
King County
Reproductive System
It's every health and science teacher's favorite subject to cover: the reproductive system. This comprehensive lesson introduces adolescents to the reproductive anatomy of men and women with the help of a series of diagrams, discussions,...
Curated OER
Maximize It!
Students design a rectangular box without a lid that has the largest possible volume using the supplied sheet of centimeter graph paper. They work in groups to construct different size boxes to determine the largest possible volume and...
Curated OER
Worksheet #12 - Logarithms
In this worksheet, students convert exponential expressions into an equivalent logarithm and visa versa. They find the exact value of logarithmic expressions and determine the domain of a given function. Finally, students use...
Curated OER
Calculus: Graphical, Numerical, Algebraic
Students explore the interplay between the geometric and analytic information and on the use of calculus both to predict and to explain the observed local and global behavior of a function. They write a paragraph describing any...
Curated OER
Woody Sine
Students explore the concept of sine. In this sine lesson, students create a sine graph from tooth picks. Students create a unit circle with tooth pick length radius. Students then take the tooth picks from the unit circle and put them...
Curated OER
Strike a Pose: Modeling in the Real World (There's Nothing to It!)
Adjust this lesson to fit either beginning or more advanced learners. Build a scatter plot, determine appropriate model (linear, quadratic, exponential), and then extend to evaluate the model with residuals. This problem uses real-world...
Curated OER
Exploring Quadratic Equations
Eleventh graders explore quadratic equations. In this Algebra II lesson plan, 11th graders use Geometer’s Sketchpad to explore the properties of quadratics and the connections with polynomials and linear equations. The lesson plan is...
Pennsylvania Department of Education
Analyzing Numeric and Geometric Patterns of Paper Pool
Students use concrete and pictorial representation of geometric patterns to extend patterns. In this geometric patterns lesson plan, students identify patterns and extend them.
Curated OER
Exploring Centers of Triangles
Students explore properties of triangles using angle bisectors, incenters, circles, midpoints, and altitudes. They use Geometer's Sketchpad in order to create triangles and their properties.
Pennsylvania Department of Education
Alike and Different
Students compare and contrast objects and are introduced to a Venn Diagram. In this alike and different instructional activity, students make observations regarding properties of objects. Students classify object and build ideas about...
Curated OER
Words for Algebra
Pupils rewrite word problems using symbols. In this algebra lesson, students relate algebra to the real world. They identify the correct steps to take when solving word problems.
Other
Nearpod: Functions & Function Notation
In this lesson plan on functions, students explore how to identify and create functions. Then students use functions to solve real-world problems.
Other
Nearpod: Graphing Equations Using a Table
In this lesson on graphing equations using a table, students will learn how to create a table for a function in terms of domain and range and then graph the function on the coordinate plane.
Illustrative Mathematics
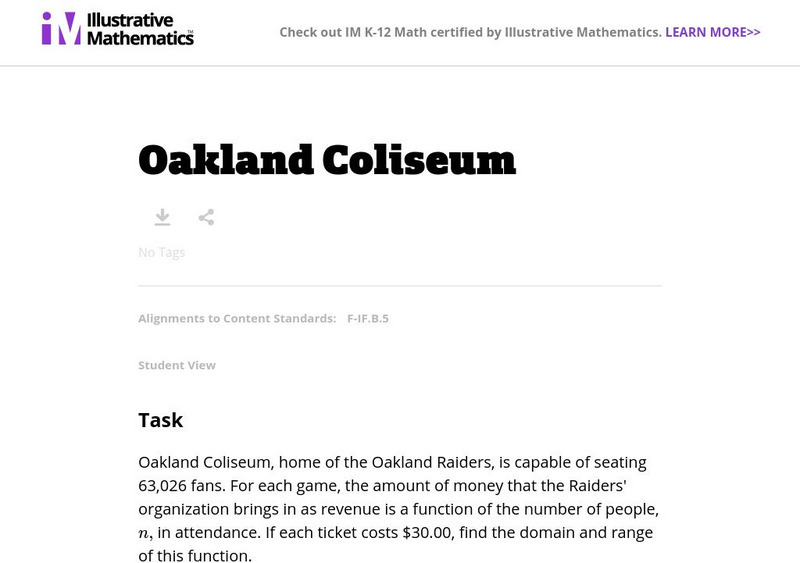
Illustrative Mathematics: F if Oakland Coliseum
In this task, students are asked to find the domain and range of a linear function in the context of ticket sales at the Oakland Coliseum. Aligns with F-IF.B.5.
Illustrative Mathematics
Illustrative Mathematics: F if Your Father
This is a simple task which has students analyze functions where they assign a father to each student. It addresses the idea that not all functions have real numbers as domain and range values, and the issue of when a function admits an...


