Curated OER
Which Method Will You Choose? Finding Solutions to Systems of Equations.
Ninth graders investigate systems of linear equations. In this Algebra I lesson plan, 9th graders determine which method is the best for solving a systems: graphing, substitution, or elimination. Students choose...
Curated OER
College Costs are on the Rise
Learners examine college costs in different states. In this college cost lesson, students create a table and determine the average cost of college for the states listed. They organize the data into measurement categories. Learners create...
Curated OER
Giving it 100%
Learners build knowledge about the number relationships between decimals and percents as it relates to converting decimals into percents. In this decimal and percent lesson, students recognize equivalent forms of fractions,...
Curated OER
The Disappearing Honeybees: Tracking Honeybee Decline
Students practice graphing and other math skills to track number of honeybee colonies present in United States since 1978, discuss major crops that are dependent on insect pollinators, and examine reasons for decline of United States...
Curated OER
Infusing Equity in the Classroom by Gender
Students investigate the idea of gender descrimination in the classroom. In this algebra lesson, students collect data in stereotyping, and gender bias in the classroom, school materials and activities. They graph and analyze their...
Curated OER
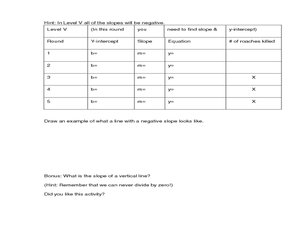
Cockroach Slope
Students identify the slope of linear functions. In this slope lesson, students collect data and graph it. They write equations with no more than two variables and use technology to explain their data.
Curated OER
Quadratic Functions and Stopping Distance
Learners solve quadratic equations. In this algebra lesson, students factor and graph quadratic functions. they use the properties of quadratics to calculate the distance.
Curated OER
Survey and Tally
Second graders view a model of a survey and tally. In this survey and tally instructional activity, 2nd graders decide on questions for a survey. Students conduct the survey and tally their results. Students create a...
Curated OER
ACC Basketball Statistics
Students use math skills and create a spreadsheet. In this statistics and computer skills lesson, students gather ACC basketball statistics, convert fractions to decimals and then percents. Students use the gathered information to create...
Curated OER
The Jellybeans and the Big Dance
Enchant your youngsters by reading them The Jellybeans and the Big Dance, by Laura Numeroff and Nate Evans. Ask them to name objects that begin with the letter J like jellybeans. Give each of them some jellybeans to sort by color....
Curated OER
Buffon's Needle An Analysis and Simulation
If you dropped a needle on a lined sheet of paper what is the probability that the needle will cross one of the lines on the page? Surprise your class with how calculating this probability can approximate pi. This question is known...
Curated OER
Pets Galore!
Fourth graders conduct a class survey on the number of pets that the 4th grade owns and they record that data in their math notebooks. They make a bar graph displaying the results using a spreadsheet through Microsoft Excel.
Curated OER
Bon Voyage Math
Sixth graders investigate the cost of throwing a party. In this cost of throwing a party lesson, 6th graders have to throw a going away party for 2 exchange students given a $350 budget. Students work in groups to determine...
The New York Times
Fiction or Nonfiction? Considering the Common Core's Emphasis on Informational Text
Nothing aids in comprehension more than an explanation and understanding of why things are done. Address why the Common Core requires the reading percentages that it established and analyze how this affects your readers. Learners read...
Curated OER
Practice with Systems of Equations
Students solve systems of inequalities. In this algebra lesson plan, students solve a system of equation, using substitution, linear combinations and graphing. They identify the number of solution each system produce as infinitely...
Curated OER
FCAT Real World Solving Linear Equations/Systems
Pupils relate real life situation to the equations, graphs and inequalities. They model real life scenarios using matrices and draw conclusions from their data. This lesson plan is aligned with FCAT.
Curated OER
Frequency Tables and Stem-and-Leaf Plots
Students are introduced to the function of frequency tables and stem and leaf plots. In groups, they determine the frequency of their teacher coughing, ringing a bell or raising their hand. To end the lesson, they determine frequency...
Virginia Department of Education
Slope-2-Slope
Pupils build on previous experience with slope to investigate positive, negative, zero, and undefined slope. They complete a puzzle matching slope-intercept and standard forms of linear equations.
Virginia Department of Education
Quadratic Equations
Review the multiple methods of solving quadratic equations through an analysis of the discriminant. Scholars use the discriminant to determine the best solution method and then solve various equations. As a challenge, learners build...
Curated OER
Prime and Composite Numbers, Prime Factorization
Middle schoolers research prime and composite numbers. With a partner, students use graph paper to draw rectangles of various sizes. They list the dimensions of rectangles and discuss how the dimensions relate to the factors of each...
EngageNY
Rational Numbers on the Number Line
Individuals learn how to plot rational numbers on the number line in the sixth lesson of a 21-part module. They identify appropriate units and determine opposites of rational numbers.
Virginia Department of Education
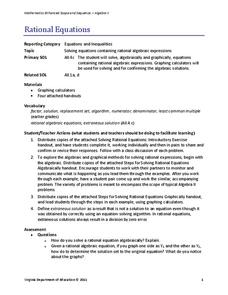
Rational Equations
Provide guidance and practice of the useful skill: solving rational equations using both an algebraic and graphical approach. Pupils solve increasingly more difficult rational equations using algebraic methods. After, they...
Curated OER
Organizing And Reading Data
Students complete three parts of an "Organizning and Reading Data" worksheet. First, they go over the rubric to determine the work will be scored. They organize data by taking tallies, make a pictograph and a bar graph using the data....
Curated OER
Linear Functions, Restricted Domains, Infinite Geometric Series, Interconnections
In this math worksheet, students graph the linear functions in comparison to the inequalities. Then they compare the line segments on the coordinate plane.


