Curated OER
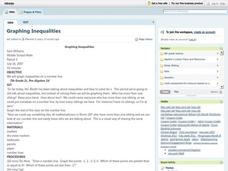
Graphing Inequalities
Students graph inequalities on a number line and discuss how to solve for one variable. The teacher models examples as students take notes. In groups, students participate in an activity to demonstrate inequalities on a number line. ...
Virginia Department of Education
Inequalities
Compare graphing an inequality in one variable on a number line to graphing an inequality in two variables on a coordinate plane. Young mathematicians work on a puzzle matching inequalities and their solutions. They then complete a...
Achieve
Rabbit Food
Keep your pets slim, trim, and healthy using mathematics! Pupils use a linear programming model to optimize the amount and type of food to provide to a pet rabbit. They model constraints by graphing inequalities and use them to analyze a...
Curated OER
Interval Notation and Linear Inequalities
In this interval notation and linear inequalities worksheet, students use number lines and solve equations. Students complete 64 problems total.
Curriculum Corner
7th Grade Math Common Core Checklist
With so many math standards to fit into a school year, it can be difficult keeping track of what you have and have not covered. This collection of Common Core checklists allows you to maintain a running record of when each standard was...
Curated OER
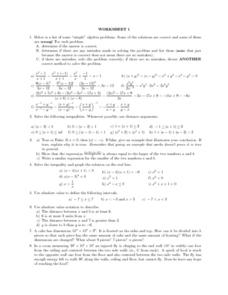
Worksheet 1: Algebra and Inequalities
Challenge your students' algebra skills with this activity, which presents students with several types of problem sets, including solving inequalities, graphing, word problems, and a set of algebra problems that may or may not require...
Houghton Mifflin Harcourt
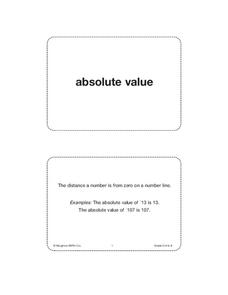
Unit 8 Math Vocabulary Cards (Grade 4)
Enhance fourth graders' math vocabulary with 17 word cards and their definitions. Learners focus on terms that deal with graphing, such as y-axis, coordinates, plot, and ordered pair in the last set of math vocabulary cards.
Mathematics Assessment Project
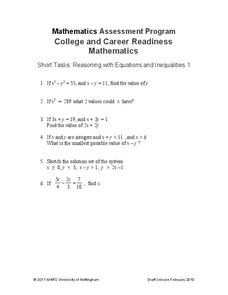
Reasoning with Equations and Inequalities
Provide class members with an opportunity to practice reasoning. A resource contains six skill-based items aligned to the Common Core. The items require pupils to reason abstractly and attend to precision.
Houghton Mifflin Harcourt
Unit 8 Math Vocabulary Cards (Grade 5)
Reinforce math vocabulary with a set of flash cards. With a total of forty-eight cards, each are printed in bold font, and include definition cards that offer a labeled example. Terms include absolute value, ordered pair, variable and...
Curated OER
Inequalities 7.3
Graph inequalities and discuss the difference in their slopes. Learners observe rate of change as they compare linear, quadratic, and cubic functions.
Curated OER
Intersections, Unions, and Compound Inequalities
In this algebra worksheet, students graph inequalities on number lines. Two problems are written in interval notation. The other five problems require students to graph and then write in interval notation.
Curated OER
An Introduction To Solving And Graphing Inequalities
Young scholars graph inequalities and solve the equations. In this algebra lesson, students graph their solutions on a number line and create an inequality for a word problem.
Curated OER
Systems of Equations and Inequalities
This is a comprehensive lesson on creating and solving equations and systems of equations and inequalities. Problems range from basic linear equations to more complex systems of equations and inequalities based on a real-world examples....
Curated OER
Linear Inequalities in Two Variables
Graph and solve linear equations in two variables. The class relates the concepts of linear equations to the real world.
Curated OER
Solving Inequalities and Graphing on a Number Line
Students review solving equations. They solve an inequality and discuss how to graph it. Students work together on one inequality and then graph two on their own. This lesson plan contains links to a PowerPoint and a worksheet.
National Security Agency
Systems of Equations and Inequalities
High school classes can use manipulatives too! Offer hands-on, interactive lessons that venture away from the typical day in your algebra class. Young mathematicians will be involved in collaborative learning, visual representations, and...
EngageNY
Perimeter and Area of Polygonal Regions Defined by Systems of Inequalities
When algebra and geometry get together, good things happen! Given a system of inequalities that create a quadrilateral, learners graph and find vertices. They then use the vertices and Green's Theorem to find the area and perimeter of...
Curated OER
Graphs, Equations and Inequalities
In this graphs, equations and inequalities worksheet, high schoolers graph inequalities. They read graphs and interpret them. Students draw curves with equations. This 12 page worksheet contains approximately 70 problems. Answers are...
Curated OER
Solving Inequalities
This is a nice worksheet on solving one variable and compound inequalities. Learners solve inequalities and graph the solution on a number line. The two page worksheet contains explanation and sixteen practice problems.
Curated OER
Linear Inequalities
Through exploration of linear programming through graphs and equations of inequalities, students relate linear programming to real life scenarios, such as business. Graphing and shading is also part of this exercise.
Curated OER
Graphing Systems of Inequalities
Solve equations and graph systems of inequalities. Designed as a lesson to reinforce these concepts, learners revisit shading and boundaries along with solving linear inequalities.
Curated OER
Compound Inequalities and Graphing
Put geometry skills to the test! Learners solve compound inequalities and then graph the inequalities on a coordinate plane using their geometric skills. They identify the slope and y-intercept in order to graph correctly. I like this...
Curated OER
Relations and Graphs
Here is a simple, yet clever lesson on how to teach the important concepts of greater than, less than, and equal to. Pupils write their names down on grid paper - one letter per box. They compare their names and find a name that is...
Curated OER
Using Bar Graphs
What's your favorite pizza topping? Scholars analyze two bar graphs, one depicting a math club's favorite pizza toppings and the other ice cream sales per flavor. As they examine the graphs, learners answer a few comprehension questions....


