Curated OER
Inequalities in Two Variables
In this algebra worksheet, students solve and graph 3 linear inequalities on coordinate systems. They solve and graph 3 systems of linear inequalities on a coordinate grid.
Curated OER
Two-Variable Linear Inequalities
Here is an engaging instructional activity on solving equations with two variables. Have the class rewrite linear equations in the slope intercept form, y=mx + b. They graph the lines using the slope and y-intercepts.
Curated OER
Math--Pictures and Bars--Learning About Graphs
What is a graph? What does it tell us? How do you make one? These are all questions that are answered in the included packet. It's a great introduction to graphing for young learners!
Curated OER
College Prep Algebra, Inequalities
In this algebra worksheet, students solve and graph 10 linear inequalities. Students must remember to alter the inequality when the negative sign is on the variable.
Curated OER
Graphing Names in Historic Cemetery
Students collect information from headstones about names of the deceased in their local community. They determine the most common names and graph them. They discuss their findings with the class.
Raytheon
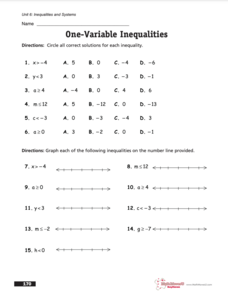
Inequalities and Systems
For this one variable inequalities worksheet, middle schoolers circle the correct solutions, complete graphing problems, and solve for the variables. Students complete 37 problems.
Curated OER
Systems of Linear Inequalities
Graphing systems of linear inequalities is the focus of this worksheet. Problems range from checking solutions of inequalities, graphing systems of two inequalities, and graphing systems of three inequalities. Graphing horizontal lines,...
Curated OER
Solving Linear Inequalities
Walk the class through the steps of how to evaluate linear inequalities in one variable and graph the solution set. Define and discuss key vocabulary terms, then have individuals work problems of varying difficulty. Included are word...
Curated OER
Solving Multi-Step Inequalities
Ready to study inequalities with your class? Use this learning exercise to solve multi-step inequalities and graph the solutions. The document would be great to use as a study guide as you present the material, or could easily be...
Curated OER
Graphing Inequalities and Shading
Students graph and shade inequalities. In this algebra lesson, students graph inequalities using the slope-intercept form. They shade the side of the line that is the solution and identify the domain and range.
Bowland
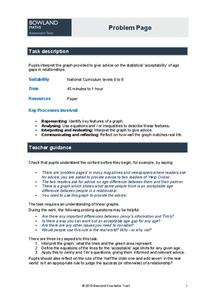
Problem Page
Future mathematicians use a given graph to answer a question about age differences in relationships. Along the way, they must find the equation and inequality of given graphs.
Curated OER
Quick Graphs of Linear Equations
Graph equations of lines using the slope-intercept method or by plotting both x and y intercepts. Determine if two lines are parallel or perpendicular by comparing their slopes. This handout includes step-by-step directions and four...
Curated OER
Venn Diagrams, Part 3
Can your first graders interpret Venn diagrams? Different sets of clues help pupils narrow down a specific number in different shapes. They determine odds and evens, greater than or less than, and what shape the number is in. A fun...
Curated OER
Reading Tally Charts #2
Keep count with tally marks! First graders practice reading tally marks with this straightforward learning exercise. They work with interpreting data from a chart, as well as working with addition and subtraction under 20. A great math...
Houghton Mifflin Harcourt
Unit 1 Math Vocabulary Cards (Grade 1)
Reinforce mathematical vocabulary with the use of flash cards. Each card showcases a boldly typed word as well as a labeled picture representation of the word. Terms include addition, subtraction, greater than, less than, and more!
Curated OER
Using Graphs and Charts
Students complete T charts and manipulate numbers using graphs and charts. In this math graphs and charts instructional activity, students review the concepts of pattern and function. Students then complete practice pages where they...
Curated OER
What Functions do Two Graph Points Determine?
Your algebra learners write linear, exponential, and quadratic equations containing the same two graph points in this collaborative task.
Curated OER
Graphing Linear Equations on the TI-73
Eighth graders work in pairs with a TI-73 graphing calculator to complete a multiple-choice review using the Classroom Performance System. Each team uses a remote unit to "click in" the answers. When all teams have completed the review,...
EngageNY
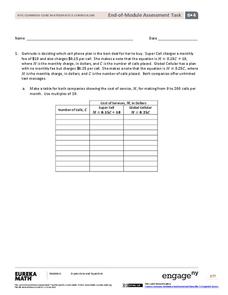
End-of-Module Assessment Task: Grade 6 Math Module 4
Finish out the module with a bang. The last installment of a 36-part module is an end-of-module assessment task. Test takers set up equations to represent relationships and solve problems in an assortment of contexts.
Math Drills
Multiplication Five Minute Frenzy (E)
How fast can you multiply one- and two-digit numbers? Have kids keep track of their success as they work on these math drills. Each grid features ten numbers on the x axis that kids can multiply by the ten numbers on the y axis.
Curated OER
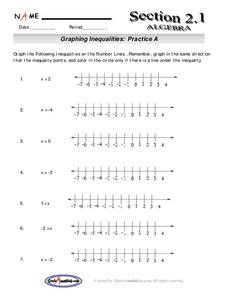
Graphing Inequalitites
Ninth graders graph inequalities. In this algebra lesson, 9th graders graph equations on a number line using inequalities and plain numbers. They solve inequalities with negative numbers also.
Curated OER
Five Multiple Choice Graphing Inequalities Problems
In this graphing inequalities worksheet, learners solve six multiple choice problems regarding inequalities and their graphs. The solutions are provided.
Curated OER
Graphing Linear, Circular, and Parabolic Inequalities
For this graphing worksheet, students are given nine inequalities and then must graph five of their intersections. A grid and cartoon hint are provided.
EngageNY
End-of-Module Assessment Task - Algebra 1 (Module 1)
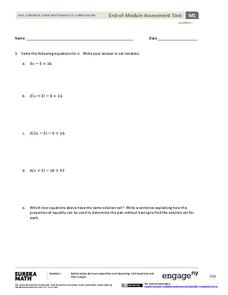
What do your young geniuses really know? Assess the procedural knowledge of your pupils at the same time as their higher-level thinking with an assessment that identifies their depth of knowledge. Topics include solving...


