Curated OER
The Titanic 3
Can survival rates on the Titanic be explained by the "women and children first" policy or did rescue procedures favor the wealthy? Use actual historical data to explore conditional probability and independent events with your class....
Curated OER
Using Random Sampling to Draw Inferences
Emerging statisticians develop the ability to make inferences from sample data while also working on proportional relationships in general. Here, young learners examine samples for bias, and then use random samples to make...
Curriculum Corner
Sports of All Sorts
Do your learners love sports? Do they love math and reading? If the first answer is yes and the second is no, a resource with sports-themed math and literacy games may change their minds! Learners move through stations to practice...
Statistics Education Web
10,000 Steps?
Conduct an experiment to determine the accuracy of pedometers versus pedometer apps. Class members collect data from each device, analyze the data using a hypothesis test, and determine if there is a significant difference...
EngageNY
Euler’s Number, e
Scholars model the height of water in a container with an exponential function and apply average rates of change to this function. The main attraction of the lesson plan is the discovery of Euler's number.
Curated OER
Human Coordinate Plane: An Array of Desks
Use a kinesthetic activity to elucidate ordered pairs and coordinate planes. Arrange desks in a square array and distribute to learners cards with ordered pairs based on the locations of their seats. By having various groups of...
West Contra Costa Unified School District
Comparing Linear and Quadratic Functions
If a linear function and a quadratic function enter a boxing match, which one would win? Learners first review how to find key features of linear and quadratic functions. Next, they compare key features of pairs of functions.
Yummy Math
US Holiday Candy Sales
Candy is a big business! Calculate the amount of money consumers spent on major holidays—Easter, Halloween, Christmas, Hanukkah, and Valentine's Day—based on the total amount of candy sales from 2011 and the percentage of each holiday's...
Curated OER
Integers
In this integers worksheet, 8th graders solve 10 various types of problems to include rewriting each statement using the convention for Positive integers and then calculate their answer. They also rewrite each statements without the...
Curated OER
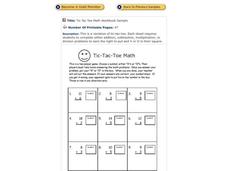
Tic-Tac-Toe Math
In this addition worksheet, students pair up in twos and work through the addition problems, then put a 'x' or an 'o' in their box. The student that gets their symbol in a row, wins.
Curated OER
Investigating Patterns to Develop Logarithm Rules
For this logarithmic worksheet, learners make conjectures regarding the rules for condensing and expanding logarithms by investigating patterns. This is designed to be done as a group activity.
Curated OER
Selling Fuel Oil at a Loss
Learners are asked to advise a fuel oil dealer on a possible investment. They must use two different rates to set up an equation and solve to determine how much oil he should sell now to break even after selling the remainder the next...
Curated OER
Halves, Thirds, and Sixths
An excellent activity that effectively pulls together the concepts of area, fractions, and equivalent fractions! Using 3x2 rectangular arrays, 3rd graders are introduced to the concept of area in terms of square units. Building on this...
Illustrative Mathematics
What is a Trapezoid? (Part 1)
Challenge your class to construct a definition for trapezoids. Looking at four examples and four non-examples, learners individually create definitions and use them to classify an unknown shape. Allow for small group and whole-class...
Curated OER
Fireworks: A Whole Group Activity for November Fifth, Diwali, New Year's Eve, or the Chinese New Year
In this holiday elapsed time instructional activity, students determine a method to calculate how much time it would take to set off a box of 28 fireworks if one must allow six minutes for each fireworks. They determine what time they...
Curated OER
Division Grouping
In this division grouping worksheet, students draw circles around groups of items, as instructed, for a total of 8 sets. A reference web site is given for additional activities.
Curated OER
Beginning Division: Divide Into Groups
In this beginning division worksheet, students draw circles around groups shown, dividing sets of objects. A reference web site is given for additional activities.
Curated OER
Where Do I Belong? Shape Activity
In this shape worksheet, students color shapes that belong with a group, and write an X on shapes that do not. A variety of shapes are used, 6 sets total.
Virginia Department of Education
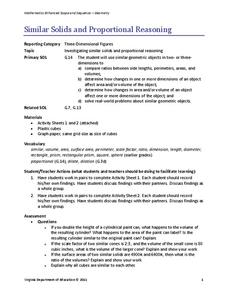
Similar Solids and Proportional Reasoning
Double the dimensions, quadruple the surface area. Pairs build similar prisms and compare the ratios of their surface areas and volumes to the ratio of the heights. Given two similar cones, partners determine the ratios of the lateral...
Curated OER
Math Fall Fun Sheet
In autumn math activity worksheet, learners practice their simple addition skills by adding horizontal math problems that range in numbers from one through ten. Students also incorporate fall images into their math equations by adding a...
Curated OER
Graphing Groups
In this graphing learning exercise, students graph sets of colored shapes, using a pair of bar graphs beside each set. A reference web site is given for additional activities.
Curated OER
What's the Average?
Practice finding the averages of different groups of numbers. Third graders review an example at the top of the page, then find the averages of fourteen groups of numbers (with eight numbers in each group). The instructional activity is...
Fluence Learning
Writing an Opinion: Student Council
A three-part assessment challenges scholars to write opinion essays covering the topic of the student council. After reading three passages, writers complete a chart, work with peers to complete a mini-research project, answer...
Illustrative Mathematics
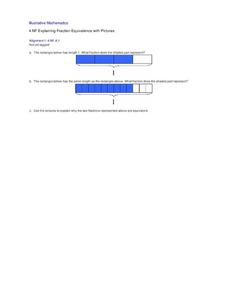
Explaining Fraction Equivalence with Picture
Visual models are a great tool for demonstrating the concept of equivalent fractions. Given two pictures, young mathematicians first identify each fraction and then write an explanation for why they are equivalent. Use as a guided...


