Alabama Learning Exchange
Bloodstain Pattern Doesn't Lie......
An interesting instructional activity on hypothesizing about the diameter of a drop of blood that is splattered. To test their theories, learners work in groups to make blood droplets splatter from different heights. They use graphed...
5280 Math
Integer Interpreter
Can you add variables if you don't know their value? Using an empty number line, scholars first locate the position of the difference, sum, product, and quotient of two unknown integers. Later problems mix operations as well as add...
Illustrative Mathematics
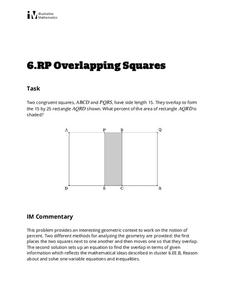
Overlapping Squares
The objective of this activity is to find the percent of the area of a two squares overlapping. Mathematicians find the ratio of area for the part that overlaps to the rectangle formed. The final answer is a percent as a rate per 100....
Curated OER
Words for Algebra
Learners rewrite word problems using symbols. In this algebra instructional activity, students relate algebra to the real world. They identify the correct steps to take when solving word problems.
Pennsylvania Department of Education
Fractional Parts Using an Area Model
Learners explore multiplying fractions and their relationship to parts of a whole. They draw and shade fractional parts to show parts of a whole and fractional parts of a fraction. Pupils also use an Internet site for interactive practice.
Curated OER
Geometry: Calculating Volumes
In this volume learning exercise, students find the volume of 8 prisms. Students are given the length, width, and height of each prism.
Curated OER
Slippery Slope
Students define patterns, relation and function. In this algebra lesson, students find the slope of a line and write equations of line. They model the slope using real life scenarios.
Alabama Learning Exchange
"Like Terms", I Add Them
Ninth graders add and subtract polynomials. In this Algebra I lesson plan, 9th graders work practice problems as they view a PowerPoint presentation of the lesson plan. Both the horizontal and vertical methods of addition and...
Curated OER
Finding the Area & Volume of Buildings Using Architectural Drawings
Fifth graders find the area and volume of buildings. In this architecture lesson plan, 5th graders look at the drawings of three historic Tennessee buildings. They use these to help find the area and volume of the building.
Curated OER
Lines of Best Fit
Students explore the concept of line of best fit. In this line of best fit lesson, students find lines of best fit in examples about riding your bike home from school and dentistry. Students find two data points and find the line of best...
Curated OER
Whose Line is it Anyway?
Students solve systems of equations. In this algebra lesson, students identify the domain and range of each function. They use the slope and y-intercept to graph each line.
Curated OER
Calculating Areas of Rectangles
In this geometry worksheet, students calculate the areas of rectangles. They use the formula for area of a rectangle.
Curated OER
Lines of Best Fit
Young scholars determine if there is an associationm in a scatter plot of data. They analyze data through predictios, comparisons, and applications. Students calculate the line of best fit using a graphing calculator. They display data...
Curated OER
Purchasing A Used Car
Seventh graders investigate the practice of purchasing a used car with the help of links and resources found in the lesson plan. They conduct research to find the right kind of car using a variety of resources. Students examine data in...
Curated OER
Geometric Probablitiy: Spinners and Dartboards
Sstudents explore and analyze the properties of geometric areas. In this geometry lesson plan, sstudents use technology to simulate spinners and dartboards in order to fing areas of circles and sectors of circles and compare and...
Curated OER
Exploring Volume of Cylinders
Tenth graders investigate the volume of a cylinder. In this geometry lesson plan, 10th graders create three-dimensional cylinders and use a ruler to determine the dimensions. The lesson plan progresses to the use of the formula to find...
Curated OER
Sinusoidal modelling of Canad'a youth cohorts
Students explore the general form of the sine equation. In this trigonometry lesson, students explore the relationship between the changing parameters and the graph of the sine equation. Students use data and a statistical software...
Curated OER
Using Concept Maps to Design 3D Spheres
High schoolers create three dimensional shapes using concept maps. In this geometry lesson, students investigate the impact of mental schemas on humans. They collect data on this topic and plot their data on a coordinate plane.
Curated OER
No Flaw With Newton’s 1st Law
Students explain what inertia is in their own words. In this physics lesson, students investigate how Newton's first law applies to their robot. They discuss real world examples of the 1st law.
Curated OER
Why is My Honey Runny?
Middle schoolers identify the factors that affect viscosity of substances. In this chemistry lesson, students define what viscosity is in their own words. They give real world applications of viscosity.
Curated OER
Means of Growth
Students collect and graph data. For this statistics lesson, students analyze their plotted data using a scatter plot. They identify lines as having positive, negative or no correlation.
Curated OER
Cafeteria Mayhem
Students design a cafeteria floor plan. In this area and perimeter lesson, groups create an efficient lunchroom layout on poster board by using geometric shapes and formulas as the basis for their designs. In the accompanying writing...
Illustrative Mathematics
Molly's Run, Assessment Variation
Part of as assessment series, the activity follows the lesson Molly's Run to practice ratios and dividing with fractions. Different solution options are given for your learners' preference. The commentary explains how the standards...
Kenan Fellows
Climate Change Impacts
Turn up the heat! Young mathematicians develop models to represent different climates and collect temperature data. They analyze the data with regression and residual applications. Using that information, they make conclusions about...


