Curated OER
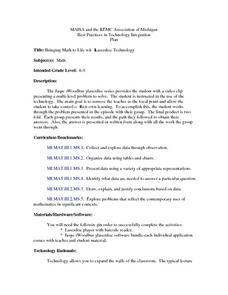
Bringing Math to Life with Laserdisc Technology
Pupils explore various problems. They present their final results and explain the path they followed in order to obtain their answers. Students show their written work as well as orally explaining their work.
Curated OER
Mathematics Alive: Environment and Design of Human Habitats
Third graders explore the structural composition of buildings and houses. In this math lesson, 3rd graders explain how architecture is related to mathematics. They create a blueprint of a structure with at least three different spaces.
National Research Center for Career and Technical Education
Transportation, Distribution, and Logistics: Tire and Wheel Assemblies
Is bigger really better? By the end of this lesson, learners will be able to apply formulas for computing the diameter of tires and wheel assemblies. Begin by showing a slide presentation that will review definitions for radius and...
Curated OER
Many Paths
Students explore the composition and practical application of parallel circuitry, compared to series circuitry. They design and build parallel circuits and investigate their characteristics, and apply Ohm's law. They recognize that...
Curated OER
The Bean Growth Experiment
Fifth graders use modern technologies which allow them to gain a new, dynamic, and intersting understanding of themselves, their community, and the world. They focus on environmental education and the effect of the environment on plant...
Curated OER
A Picture is Worth a Thousand Words
Pupils create various types of graphs. They go to suggested websites to collect data and create graphs to organize the data. Then they answer questions according to their graph.
Visa
Pro Lesson Module — Financial Football
Learners won't fumble their knowledge of personal finance after an engaging game of Financial Football! As they choose their favorite teams and desired plays, young economists demonstrate their financial literacy with a question ranging...
EngageNY
Analyzing Data Collected on Two Variables
Assign an interactive poster activity to assess your class's knowledge and skill concerning data analysis. The teacher reference provides solid questions to ask individuals or groups as they complete their posters.
Kenan Fellows
Climate Change Impacts
Turn up the heat! Young mathematicians develop models to represent different climates and collect temperature data. They analyze the data with regression and residual applications. Using that information, they make conclusions about...
Shodor Education Foundation
Sequencer
Take the first step into graphing sequences. Learners set the starting number, multiplier, add-on, and the number of steps for a sequence. Using the inputs, the interactive calculates and plots the sequence on the coordinate plane. Users...
Shodor Education Foundation
Caesar Cipher
Caesar ciphers hide secret missives. A simple interactive lets users encode and decode hidden messages. The cipher method here is the Caesar shift.
Shodor Education Foundation
Simple Coordinates Game
Let coordinate pairs show you the way home. Scholars plot houses on a coordinate plane with given coordinates using an interactive app. Alternatively, they can identify the coordinates of houses already plotted on a coordinate plane.
Shodor Education Foundation
Simple Maze Game
Avoid the mines and win the game! Young scholars direct a robot through a minefield by plotting points. Their goal is to reach the target in as few moves as possible.
Shodor Education Foundation
Graph Sketcher
Sketch graphs with the Graph Sketcher. Scholars graph functions on a coordinate plane. An interactive makes it as easy as inputting the function and clicking a button.
Shodor Education Foundation
Whole Number Cruncher
Time to crunch the numbers! Young scholars use an interactive number cruncher to practice operations with whole numbers. They input a number and watch as the number cruncher produces the output and then use the data pairs to determine a...
Shodor Education Foundation
Box Plot
What information can come from a box? Learners choose a data set to display as a box plot and decide whether to include the median in the calculation of the quartiles, show the outliers, and change the scale. To finish the lesson,...
Shodor Education Foundation
Experimental Probability
Spin into a dicey experiment. Pupils use a spinner or a pair of dice to determine the experimental probabilities of each outcome. The interactive allows for either, one, five, or ten consecutive experiments. Using the applet, learners...
Shodor Education Foundation
Racing Game with One Die
Pupils roll a die to figure out which car advances on a race track. They determine the rules for each car moving forward and, given the statistics of the winner, compare if it matches their predictions.
Shodor Education Foundation
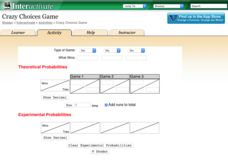
Crazy Choices Game
Wanna take a chance on which game is best? The resource provides three games of chance using multiple types of games. Games range from coin toss to cards. Choosing a type of game, pupils determine what wins and enter the theoretical...
Shodor Education Foundation
Spinner
Go round and round to compare theoretical and experimental probabilities. Learners set the number of sectors and the number of spins for a spinner. Then, a table displays the experimental and theoretical probabilities of the spinner for...
Shodor Education Foundation
Marbles
Grab some marbles from a bag. The applet simulates drawing marbles from a bag. Pupils determine the number of four colors of marbles in a bag and how many marbles to draw. Using information on whether order matters in the draw and if...
Shodor Education Foundation
Plop It!
Build upon and stack up data to get the complete picture. Using the applet, pupils build bar graphs. As the bar graph builds, the interactive graphically displays the mean, median, and mode. Learners finish by exploring the changes in...
Shodor Education Foundation
Measures
Take a look at data from a statistical lens. An interactive allows pupils to enter data set, labeling the data including the units used. Manipulating the applet, learners select the statistics to calculate that include total, mean,...
Shodor Education Foundation
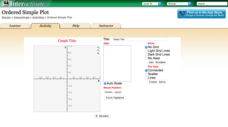
Ordered Simple Plot
Open your imagination to make algebra-inspired creations. An interactive lesson has scholars graph images from a set of parameters. Users can practice minimum values, maximum values, and scale as well as key features.


