American Statistical Association
Tell it Like it is!
Scholars apply prior knowledge of statistics to write a conclusion. They summarize using correct academic language and tell the story of the data.
American Statistical Association
EllipSeeIt: Visualizing Strength and Direction of Correlation
Seeing is believing. Given several bivariate data sets, learners make scatter plots using the online SeeIt program to visualize the correlation. To get a more complete picture of the topic, they research their own data set and perform an...
Mathematics Vision Project
Similarity and Right Triangle Trigonometry
Starting with similar triangles and dilation factors, this unit quickly and thoroughly progresses into the world of right triangle features and trigonometric relationships. Presented in easy-to-attack modules with copious application...
Curated OER
A Model Solar System
If Earth is modeled by a grapefruit, what planet could be represented by a golf ball? This activity uses everyday and not-so-everyday objects to create a model of the Solar System.
Curated OER
Mapping the Bone Field: An Area and Scale Exercise
Here is an excellent cross-curricular lesson. Learners relate multiplication to area by making a grid on graph paper, and then creating the same grid in real space outside in the school yard.
Project Maths
Inequalities
Which number is bigger? Using a variety of activity sheets, this unit starts with the basics of inequalities and progresses through solving compound linear inequalities. Problems cover the range of inequalities including inequality word...
Willow Tree
Angles Formed by Transversals of Coplanar Lines
Create a strong understanding of the relationships formed when parallel lines intersect a transversal. Discuss each type of angle pair and their relationship to each other.
Willow Tree
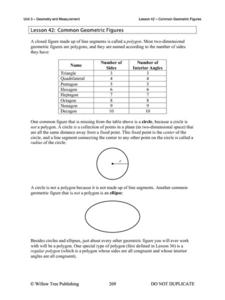
Common Geometric Figures
Geometry could be called the study of figures. An overview of the figures found in a typical geometry course contains a study of different triangles, quadrilaterals, and regular polygons.
Willow Tree
Box-and-Whisker Plots
Whiskers are not just for cats! Pupils create box-and-whisker plots from given data sets. They analyze the data using the graphs as their guide.
Curated OER
Computing the Net Force
Adorable little stick figures push and pull a cart of blocks to explain the push and pull of forces. Future physicists then define force and identify it in different situations on the instructional activity that follows. Concepts covered...
Statistics Education Web
Saga of Survival (Using Data about Donner Party to Illustrate Descriptive Statistics)
What did gender have to do with the survival rates of the Donner Party? Using comparative box plots, classes compare the ages of the survivors and nonsurvivors. Using the same method, individuals make conclusions about the gender and...
Curated OER
Water Down the Drain
Did you know that leaky faucets waste $10 million worth of water? Conservationists perform an experiment and draw best-fit lines to explore how the US Geological Society determined this value.
Teacher's Corner
Hey Batter, Wake Up!
Does jet lag affect a baseball team's performance in games? Read about how a baseball team's chance of winning a game can be affected by traveling over one, two, and three time zones. Readers then respond to five short answer questions...
American Statistical Association
Bubble Trouble!
Which fluids make the best bubbles? Pupils experiment with multiple fluids to determine which allows for the largest bubbles before popping. They gather data, analyze it in multiple ways, and answer analysis questions proving they...
Curated OER
Minimal Animals
Have fun creating imaginary creatures with this symmetry lesson plan! Your class will paint one half of their imaginary creature, fold their paper in half, which will result in a symmetrical figure. What a great art project to combine...
Curated OER
Narrow Corridor
Buying a new sofa? Learn how to use the Pythagorean Theorem, as well as algebra and graphing techniques, to determine whether the sofa will fit around a corner (which I'm sure you'll agree is a very important consideration!).
National Council of Teachers of Mathematics
Eruptions: Old Faithful Geyser
How long do we have to wait? Given several days of times between eruptions of Old Faithful, learners create a graphical representation for two days. Groups combine their data to determine an appropriate wait time between eruptions.
Everyday Mathematics
Mathematics Within: Slope and Triangles
Learners discover a method for determining the slope of a line by creating and comparing similar triangles. They fold coordinate grids to make three similar triangles then measure the sides to compare the relationships between the...
Computer Science Unplugged
Lightest and Heaviest—Sorting Algorithms
How do computers sort data lists? Using eight unknown weights and a balance scale, groups determine the order of the weights from lightest to heaviest. A second worksheet provides the groups with other methods to order the weights. The...
Mathematics Vision Project
Module 7: Trigonometric Functions, Equations, and Identities
Show your class that trigonometric functions have characteristics of their own. A resource explores the features of trigonometric functions. Learners then connect those concepts to inverse trigonometric functions and trigonometric...
Teach Engineering
Concentrate This! Sugar or Salt...
Heat up your lessons on boiling points. The resource provides a three-part activity: first, groups find the boiling point of solutions; second, they create boiling point curves for salt and sugar solutions; and third, they mix a solution...
Curated OER
Transformations in the Coordinate Plane
Your learners connect the new concepts of transformations in the coordinate plane to their previous knowledge using the solid vocabulary development in this unit. Like a foreign language, mathematics has its own set of vocabulary terms...
University of Utah
Explore Proportional and Linear Relationships
Progress from proportional relationships to linear functions. Pupils first review concepts of proportionality covered in earlier grades. They then extend these concepts to linear functions, such as determining the slope of a line using...
CK-12 Foundation
Angles of Elevation and Depression: Fly-By Calibration
Determine the distance between two trees from afar. Pupils use an interactive resource to create two right triangles using trees and a plane. They determine the horizontal legs of each triangle to find the distance between the two trees.


