EngageNY
Fundamental Theorem of Similarity (FTS)
How do dilated line segments relate? Lead the class in an activity to determine the relationship between line segments and their dilated images. In the fourth section in a unit of 16, pupils discover the dilated line segments are...
EngageNY
Using Sample Data to Compare the Means of Two or More Populations
Determine whether there is a difference between two grades. Teams generate random samples of two grade levels of individuals. Groups use the mean absolute deviation to determine whether there is a meaningful difference between the...
EngageNY
Computing Actual Lengths from a Scale Drawing
The original drawing is eight units — how big is the scale drawing? Classmates determine the scale percent between a scale drawing and an object to calculate the length of a portion of the object. They use the percent equation to find...
EngageNY
Creating a Histogram
Display data over a larger interval. The fourth segment in a 22-part unit introduces histograms and plotting data within intervals to the class. Pupils create frequency tables with predefined intervals to build histograms. They describe...
Noyce Foundation
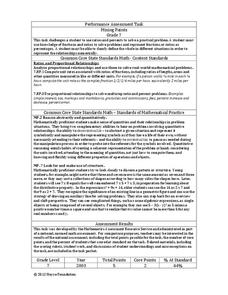
Mixing Paints
Let's paint the town equal parts yellow and violet, or simply brown. Pupils calculate the amount of blue and red paint needed to make six quarts of brown paint. Individuals then explain how they determined the percentage of the brown...
Statistics Education Web
Types of Average Sampling: "Household Words" to Dwell On
Show your classes how different means can represent the same data. Individuals collect household size data and calculate the mean. Pupils learn how handling of the data influences the value of the mean.
Charleston School District
Identifying Series and Determining Congruence or Similarity
Learners consider a set of questions to determine a series of transformations that will move one figure to another. Once the series is determined, the pupil then determines whether the pre-image and image are either congruent or similar.
Curated OER
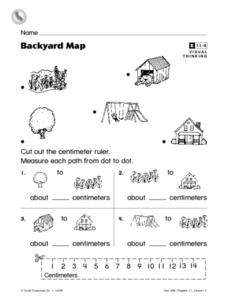
Backyard Map- Measuring with Centimeters
In this backyard map centimeter measurement worksheet, 1st graders cut out a centimeter ruler from the bottom of the page. They use the ruler to measure the path between objects which are pictures in the backyard map at the top of the...
Curated OER
Generate Measurement Data Word Problems
Using a set of simple data, learners create a line plot to organize the information. This data includes only single-digit numbers and the highest number is six. Because the answer is explained and illustrated at the bottom, project this...
Curated OER
Length Addition and Subtraction Word Problems
These measurement word problems can be tricky! Scholars will need to keep track of numbers as they determine who has the shortest bed, the longer car key, and a bus longer than nine meters. For each, there is an image depicting the...
Curated OER
Area of Rectangles in Word Problems
Apply area calculations to everyday situations using these three word problems. Mathematicians must pay attention to the needs of each space, determining the largest or smallest area of several options. Consider expanding on this by...
Curated OER
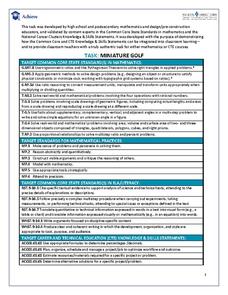
Task: Miniature Golf
"Fore!" All right, no one really yells this out in miniature golf, but this well-defined activity will have your charges using lots of numbers in their unique design of a miniature golf hole. Included in the activity criteria is the...
EngageNY
The Mean Absolute Deviation (MAD)
Is there a way to measure variability? The ninth resource in a series of 22 introduces mean absolute deviation, a measure of variability. Pupils learn how to determine the measure based upon its name, then they use the mean absolute...
Curated OER
Geometry - Angles Overview
Learners address 14 questions that include naming all pairs of opposite and supplementary angles for sets of intersecting lines and then, finding the measure of the unknown angle. They determine the measure of the angle that is...
EngageNY
End-of-Module Assessment Task: Grade 7 Mathematics Module 6
Determine the level of understanding within your classes using a summative assessment. As the final lesson in a 29-part module, the goal is to assess the topics addressed during the unit. Concepts range from linear angle relationships,...
EngageNY
Creating Division Stories
Create your own adventure story ... well, not really. The fifth lesson in a 21-part series has pairs create story contexts for division problems. The lesson presents a step-by-step process for pupils to follow in writing such stories.
EngageNY
Law of Cosines
Build upon the Pythagorean Theorem with the Law of Cosines. The 10th part of a 16-part series introduces the Law of Cosines. Class members use the the geometric representation of the Pythagorean Theorem to develop a proof of the Law of...
EngageNY
Interpreting Correlation
Is 0.56 stronger than -0.78? Interpret the correlation coefficient as the strength and direction of a linear relationship between two variables. An algebra lesson introduces the correlation coefficient by estimating and then calculating it.
EngageNY
The Inscribed Angle Alternate – A Tangent Angle
You know the Inscribed Angle Theorem and you know about tangent lines; now let's consider them together! Learners first explore angle measures when one of the rays of the angle is a tangent to a circle. They then apply their newfound...
Curated OER
Surface Area and Volume
In this surface area and volume instructional activity, 8th graders solve 11 various geometry problems that include determining the surface area and volume for the measurements given and finding the surface area for each solid shown....
Teach Engineering
Slinkies as Solenoids
What does an MRI machine have to do with a slinky? This activity challenges learners to run a current through a slinky and use a magnetic field sensor to measure the magnetic field. Groups then change the length of the slinky to see the...
Curated OER
Representing Data 1: Using Frequency Graphs
Here is a lesson that focuses on the use of frequency graphs to identify a range of measures and makes sense of data in a real-world context as well as constructing frequency graphs given information about the mean, median, and range of...
EngageNY
Describing Center, Variability, and Shape of a Data Distribution from a Graphical Representation
What is the typical length of a yellow perch? Pupils analyze a histogram of lengths for a sample of yellow perch from the Great Lakes. They determine which measures of center and variability are best to use based upon the shape of the...
Charleston School District
Review Unit 1: Exponents
What will be on the test? The resource provides comprehensive review items for the content of the unit on exponents. The resource divides the sections in the order you present the lessons during the unit.


