Curated OER
Introduction to Time
Students explore the concept of time. Through discussion and artistic projects, they define time in their own words and tell how it is used to represent the seasons. Students draw a picture to portray time as it elapses during the...
Curated OER
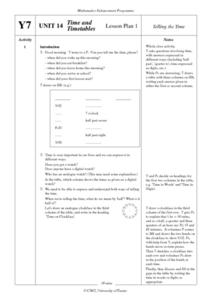
Time and Timetables
Students, after answering a variety of questions involving time expressed in different ways, draw a table to illustrate time in words as well as digits. In connection, they observe time on analogue watches and clock faces along with what...
Curated OER
Going My Way (High School Math)
Students solve uniform motion problems using formula d = rt.
Curated OER
Relating Distance and Velocity Over Time
Students calculate the distance and velocity over time. In this algebra instructional activity, students graph a linear function to represent the distance vers time travel. They interpret their graphs and draw conclusion.
Curated OER
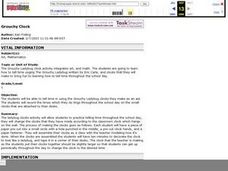
Grouchy Ladybug
First graders are going to learn how to tell time using The Grouchy Ladybug written by Eric Carle, and clocks that they will make to bring fun to learning how to tell time throughout the school day.
Virginia Department of Education
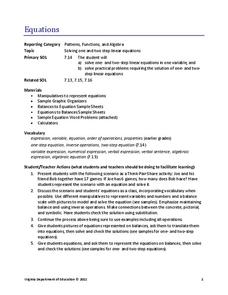
Equations
Science equipment can be handy for math class, too. Scholars learn to solve one- and two-step linear equations by using the concept of a balance. They solve real-world problems in a variety of contexts by writing and solving linear...
Virginia Department of Education
Order Up!
Order in the math class! Scholars learn to evaluate expressions using the order of operations. A game has them rolling number cubes to determine numbers to use when evaluating.
Curated OER
Clock Hands That Erase!
Students draw and decorate a clock face. They work in pairs, students take turns drawing clock hands to show a specific time on the clock face. Students check each other's clock-reading abilities.
Curated OER
How Much Do I Watch TV?
In this television watching worksheet, students determine the amount of television they watch in a week by recording the names and times of the shows. They total the number of hours of watching time. You can use this with upper...
Curated OER
Miss Nelson is Missing Lesson Plan
Second graders listen to the story Miss Nelson is Missing by Harry Allard and James Marshall. In this literature lesson, 2nd graders predict the story's ending with drawings and discussions within groups.
EngageNY
Graphs of Exponential Functions
What does an exponential pattern look like in real life? After viewing a video of the population growth of bacteria, learners use the real-life scenario to collect data and graph the result. Their conclusion should be a new type of...
EngageNY
Graphs of Piecewise Linear Functions
Everybody loves video day! Grab your class's attention with this well-designed and engaging resource about graphing. The video introduces a scenario that will be graphed with a piecewise function, then makes a connection to domain...
EngageNY
Comparison Shopping—Unit Price and Related Measurement Conversions II
Which rate is greater and by how much? Pupils continue to compare rates to solve problems in the 20th portion of a 29-part series. Rates are presented in a variety of representations either using the same representation or different...
EngageNY
Word Problems
Use several skills to solve word problems leading to systems of equations. Scholars define variables and write equations to model situations described within word problems. Pupils solve the resulting system of linear equations using...
EngageNY
Solving Area Problems Using Scale Drawings
Calculate the areas of scale drawings until a more efficient method emerges. Pupils find the relationship between the scale factor of a scale drawing and the scale of the areas. They determine the scale of the areas is the square of the...
West Contra Costa Unified School District
The Power of Ten: Building a Magnitude Model
Add visual representation to teaching place value with a magnitude model. Using adding machine tape, pupils build a linear place value strip from 1 to 100.
Kenan Fellows
Let's Move
Find a statistical reason for a fresh start. Using a hypothetical scenario, individuals research statistical data of three different cities. Their goal? Find the best statistical reason for a business to move to a new location. Their...
Columbus City Schools
Speed Racers
Who wants to go fast? The answer? Your sixth-grade science superstars! The complete resource offers the ultimate, all-inclusive playbook for mastering the important concepts of speed versus time; distance versus time; and how...
EngageNY
Connecting Graphical Representations and Numerical Summaries
Which graph belongs to which summary statistics? Class members build upon their knowledge of data displays and numerical summaries to connect the two. Pupils make connections between different graphical displays of the same data in...
EngageNY
Solving Problems by Finding Equivalent Ratios II
Changing ratios make for interesting problems. Pupils solve problems that involve ratios between two quantities that change. Groups use tape diagrams to represent and solve classroom exercises and share their solutions.
EngageNY
Creating a Histogram
Display data over a larger interval. The fourth segment in a 22-part unit introduces histograms and plotting data within intervals to the class. Pupils create frequency tables with predefined intervals to build histograms. They describe...
EngageNY
Credit Cards
Teach adolescents to use credit responsibly. The 32nd installment of a 35-part module covers how to calculate credit card payments using a geometric series. It teaches terminology and concepts necessary to understand credit card debt.
EngageNY
Addition and Subtraction Formulas 2
Knowing the addition formulas allows for the calculations of double and half formulas. The fourth installment of 16 has the class use the addition formula to develop the double angle trigonometric formulas. Using the double formula,...
EngageNY
Displaying a Data Distribution
Pupils analyze a display of data and review dot plots to make general observations about the highest, lowest, common, and the center of the data. To finish, learners match dot plots to scenarios.


