Curated OER
Central Tendency
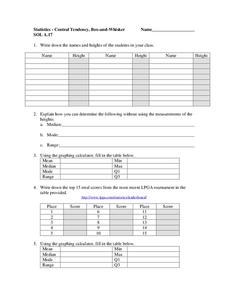
In this central tendency learning exercise, students solve and complete 10 different problems that include measures of central tendency. First, they write down the names and heights of students in their class. Then, students explain how...
Curated OER
Averages
For this averages worksheet, students complete word problems where they find the average (sometimes called 'mean') of numbers. Students complete 10 multiple choice word problems.
Curated OER
Box Plots
In this statistics worksheet, students analyze problems by finding the mean, median and mode. They also set data by their median, and quartiles. There are 7 questions dealing with 2 different sections.
Curated OER
Stem-and-Leaf Plots
In this stem-and-leaf plots worksheet, 9th graders solve and complete 9 various types of problems. First, they determine the mean, median, and mode of the stem-and-leaf plot shown. Then, students summarize the similarities and...
Curated OER
Statistics
In this statistics worksheet, 9th graders solve and complete 10 various types of problems that include using different types of graphs to illustrate data. First, they determine the median score for each stem-and-leaf plot. Then, students...
Curated OER
Stem and Leaf Plots
In this measures of central tendency worksheet, students study a stem and leaf plot pertaining to weekly low temperatures. Students use the plot to answer 6 questions. There will be a question that requires students to make their own...
Curated OER
Median, Mean, Mode, and Range
In this math worksheet, students read about the median, mean, mode, and range. The worksheet includes the following rhyme: Hey diddle diddle the median's the middle.
Willow Tree
Box-and-Whisker Plots
Whiskers are not just for cats! Pupils create box-and-whisker plots from given data sets. They analyze the data using the graphs as their guide.
Curated OER
Lesson #46: Bar Graphs and Line Graphs
For this bar graphs and line graphs worksheet, students interpret bar graphs, line graphs, and box-and-whisker plots. They find the measures of central tendency. This three-page worksheet contains notes, vocabulary, and...
Illustrative Mathematics
Puppy Weights
Nobody can say no to puppies, so lets use them in math! Your learners will take puppy birth weights and organize them into different graphs. They can do a variety of different graphs and detail into the problem based on your classroom...
Curated OER
"M&M's"® Candies Worksheet 2
In this math worksheet, students plot the mean, median, and mode for the colors of M and M candies by filling in the graphic organizer.
Curated OER
Standard Deviation
In this algebra learning exercise, students identify the mean, median and mode. They use the standard deviation to solve problems. There are 10 questions with an answer key.
Curated OER
Statistics
In this statistics worksheet, students solve and complete 6 different problems that include determining various types of statistics. First, they determine the data set where the median value is equal to the mean value. Then, students use...
Curated OER
Misleading Statistics
In this misleading statistics activity, students identify misleading graphs. They determine the mean, median and mode of given data. Students determine the measure of central tendency which accurately describes the data. This one-page...
Curated OER
Finding Range
In this range worksheet, students enter mean, median and mode for sets of number, then enter the range.
Curated OER
Fall Leaves
For this fall leaves worksheet, learners identify the colors of leaves and determine the number they have of each. This worksheet may be used in elementary grades, for color identification and counting purposes. For the middle school...
Curated OER
Averages
In this averages worksheet, 6th graders solve and complete 3 various types of problems. First, they find the mean, mode, median and range for each set of data shown. Then, students match each team to the picture shown that they think...
Curated OER
SAT Grid Ins Practice Test 09
In this SAT practice worksheet, learners solve 10 grid in problems. Students find surface area, slope, mean, factors, etc.
Curated OER
Fruit Loops/Cheerios Activity: Measures of Central Tendency
In this measures of central tendency activity, students use Fruit Loops and Cheerios to gather statistical data. They find the mean, mode and median of the data. Students construct a box-and-whisker plot of the class data. This...
Curated OER
Family Activity: Bar Graphs and Line Graphs
For this math worksheet, students work at home with a family member on a graphing activity. Students count the number of cans, glass jars, boxes and bags in the pantry. Students make a bar and a line graph to represent the data.
Curated OER
MAP Practice
In this geometry activity, students create circle, line and bar graphs using different comparisons of events. There are 24 questions with an answer key.
Curated OER
Data Analysis
In this data analysis worksheet, young scholars solve and complete 4 different types of problems. First, they reduce the data provided to find the means, and graph the means in a line graph. Then, students graph the data from each...
Curated OER
Probability and Statistics - Week 10
For this probability and statistics worksheet, students find compound dependent and independent probability of given situations. They identify the mean, mode, range and median of sets. This two-page worksheet contains explanations,...
Curated OER
High School Mathematics Problems from Alaska: Fire Fighting Crew
Students apply mean, median and mode calculations of firefighter test scores to decide on hiring.
Other popular searches
- Math/data Mean Mode Median
- Math Ata Mean Mode Median
- Math/ Mean, Mode, Median
- Math at Mean Mode Median
- Math Median Mode Mean
- Math/ Mean Mode Median


