Balanced Assessment
Chance of Rain
Will it rain during the weekend? Pupils become meteorologists for a day as they use the assessment to determine the chance of rain for Saturday and Sunday. Class members interpret the weather statements as they pertain to probabilities...
CK-12 Foundation
Interpretation of Circle Graphs: Northwest Region Population Pie
Given populations of the five Northwestern states, learners create a circle graph. Using the data and the pie chart, they make comparisons between the populations of the states. Finally, the pupils determine how the chart will change...
CK-12 Foundation
Types of Data Representation: Baby Due Date Histogram
Histograms are likely to give birth to a variety of conclusions. Given the likelihood a woman is to give birth after a certain number of weeks, pupils create a histogram. The scholars use the histogram to analyze the data and answer...
Radford University
Got Slope?
Go around and around with slope. The class investigates tornadoes by watching videos, building a homemade tornado, and performing research on the Storm Prediction Center website. Groups gather data and create scatter plots for twisters...
Math Mammoth
Percent Fact Sheet
In this math learning exercise, students are given 9 percentage problems that involve conversion, variables, story problems and fractions.
Curated OER
Circle Graphs and Percents
For this circle graph and percentages worksheet, students fill in a chart, write percentages, calculate discounts, and more. Students complete 4 sets of problems.
Curated OER
The Demographics of Immigration: Using United States Census Data
High schoolers work together to analyze United States Census data on immigration. They compare and contrast the data and determine how immigration numbers have changed over time. They calculate percentages and make their own...
Curated OER
Bits and Pieces - More About Percents - Online Manipulatives
In this online percentages worksheet, learners access the Library of Virtual Manipulatives web site and open the percentage tool. They use the online tool to complete 8 multi-step questions making graphical representations and finding...
Curated OER
Calculating Baseball Statistics
Students calculate baseball statistics. In this data analysis lesson, students use baseball statistics to calculate the batting average and slugging percentage. Students visit www.funbrain.com to play a math baseball game.
Curated OER
The Good, The Bad, The Ugly
Sixth graders examine the causes of the stock market crash of 1929. In this integrated math/history unit on the stock market, 6th graders study, research, and read stocks, visit a local bank, and create a PowerPoint to show the finished...
Curated OER
Nutrients by the Numbers
Students read and discuss an article on the amount of sugar in various food products. They compare the nutritional values of food products, calculate their daily intake of nutrients, analyze serving sizes, and compare/contrast their own...
Curated OER
M&Ms; Line Plots and Graphing
Students, using small individual bags of M&Ms, engage in activities including; estimating, sorting, graphing, mean, median, mode, fractions, percentage, and averaging.
Curated OER
Ratio Basketball
Students, in teams of four, practice shooting free throws while mentally converting the ratio of shots made to those thrown into a percent. They chart and record the ratio, decimal and actual percentage earned after each round.
Curated OER
Percents: What's the Use
Students research percentages in real world situations. In this percents lesson, students demonstrate their ability to apply percents to everyday situations. Students communicate mathematically by conducting interviews about percents and...
Curated OER
Living on Your Own -- Let's Calculate the Cost!
Young scholars review basic math skills, such as addition, subtraction, multiplication, division, finding averages, and working with percentages. They see how these skills apply to real life situations.
Curated OER
Shopping for Savings
Fourth graders calculate savings and identify the best value items from a list of products. They rotate through five studying stations, completing various math activities involving calculators and solving problems related to shopping...
Curated OER
How Much Ocean?
In this ocean activity, students are given a map of the world and they predict the amount of water that covers the Earth's surface. They count the total number of squares on the given map that represent the water and they land and they...
Curated OER
Effective Use of Living Space
Learners explore the concept of scale. In this scale lesson, students create a scale model of a room. Learners calculate the area of a room. Students determine what percentage of the room is occupied by furniture.
Curated OER
Profit and Loss
Students analyze the concept of profit and loss, the components of a simple profit and loss statement and the importance of a profit and loss statement. They calculate profits using gross income, total expenses and cost of goods sold....
Curated OER
Car Activities
In this math worksheet, students find cars in Auto Trader. They find the difference between the prices of the cheapest and most expensive cars. Students select a car they like and follow directions to buy on credit. Students complete a...
Curated OER
Percent Worksheet 15
In this percent worksheet, students calculate the percentages of two and three digit numbers. Students complete 18 problems where they calculate percentages.
Curated OER
Take Another Look
Seventh graders analyze different types of graphs and answer questions related to each. In this math lesson, 7th graders organize a given diagram to make it easier to interpret. They discuss why they made such changes.
Curated OER
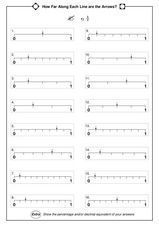
How Far Along Each Line Are The Arrows?
In this how far along each line are the arrows worksheet, students determine the length on sixteen different lines. Students show the percentage and/or decimal equivalent of their answers to each line.
Curated OER
Areas and Probabilities
In this area and probability worksheet, students solve 5 problems where they find the probability of an event occurring. They also use a given photograph of the moon's surface to find the area covered by craters and determine the...
Other popular searches
- Percentages and Math
- Calculator Math Percentages
- Learning Math Percentages
- Math Percentages Diagram
- Teaching Percentages in Math
- Math Percentages Ecology
- Math Percentages Decimals
- Teaching Math Percentages
- Football Math Percentages
- Everyday Math Percentages
- Converting Math Percentages
- Math Percentages Jerry P


