Radford University
Is it Really a Small World After All?
Working in groups, learners research four countries' populations over the past 30 years. Using the data collected, the teams find regression equations that best fit the data. Taking the regression equations, they then make predictions...
Curated OER
Barbie Bungee
Middle and high schoolers collect and analyze their data. In this statistics lesson plan, pupils analyze graphs for linear regression as they discuss the relationship of the function to the number of rubber bands and the distance of the...
Purdue University
The Case of the Pilfered Pin: A Measurement Inquiry Activity
Who pilfered the pin? Scholars practice measurement skills as they solve the mystery of a stolen pin. They measure length, temperature, and mass and determine which of select suspects committed the crime. During the STEM hands-on...
Mathematics Vision Project
Module 3: Arithmetic and Geometric Sequences
Natural human interest in patterns and algebraic study of function notation are linked in this introductory unit on the properties of sequences. Once presented with a pattern or situation, the class works through how to justify...
Noyce Foundation
Fair Game?
The game should be fair at all costs. The mini-assessment revolves around the ability to use probabilities to determine whether a game is fair. Individuals determine compound events to calculate simple probabilities and make...
Curated OER
Jelly Bean Math Activities
Using jelly beans as math manipulatives can be a tasty way to introduce and reinforce math concepts. Regardless of the time of year, candy can be used to excite learners and facilitate a wide variety of mathematical concepts.
EngageNY
Modeling a Context from Data (part 2)
Forgive me, I regress. Building upon previous modeling activities, the class examines models using the regression function on a graphing calculator. They use the modeling process to interpret the context and to make predictions...
101 Questions
Deodorant
Smells like learning! Young scholars collect data on the length of time a stick of deodorant lasts. After modeling the data with a graph and function, they make predictions about deodorant use over time.
Curated OER
Little Boy Blue
First graders read nursery rhymes and celebrate Mother Goose. For this drawing conclusions and predicting lesson, 1st graders create new ending for the nursery rhymes. Students gather data and make a graph showing their favorite rhyme.
Curated OER
Enemy Pie
Third graders pair up with a partner via an online classroom. They analyze half of the story "Enemy Pie" and communicate with their online peer to predict the outcome of the story.
Curated OER
Math TODAY - Breast Cancer Risks
Learners explore data that be modeled by a logistic function. They have the opportunity to study real-life data and create a mathematical function to model the data and make a prediction.
Curated OER
Birds' Eggs
More than just data, scatter plots are full of information that can be used to answer a variety of questions. This lesson uses a plot with information about bird egg sizes to answer questions about the relationship between length and...
101 Questions
Small Trebuchet
Travel back to medieval time where learning is just a stone's throw away! A video introduction shows a trebuchet (catapult-like machine) as it launches a rock into a lake. Learners use their quadratic modeling skills to predict the...
101 Questions
Thanksgiving Taters
What would a meal be without the taters? The question is, how long does it take to peel those potatoes? Given the rate of peeling one potato, scholars predict the time it takes to peel the bag. The twist is that the first potato was...
EngageNY
Mid-Module Assessment Task - Algebra 2 (Module 1)
Challenge classes to think deeply and apply their understanding of polynomials. The assessment prompts learners to use polynomial functions to model different situations and use them to make predictions and conclusions.
EngageNY
Modeling from a Sequence
Building upon previous knowledge of sequences, collaborative pairs analyze sequences to determine the type and to make predictions of future terms. The exercises build through arithmetic and geometric sequences before introducing...
EngageNY
Modeling with Quadratic Functions (part 1)
Relevance is key! The resource applies quadratic modeling by incorporating application of physics and business. Pupils work through scenarios of projectile motion and revenue/profit relationships. By using the key features of the graph,...
101 Questions
Ferris Wheel
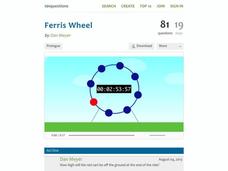
Around and around you'll go! Learners analyze the periodic nature of a Ferris wheel. Using a trigonometric function, they make predictions about the location of a specific car at the end of the ride and its total trips around the circle.
Curated OER
Making Predictions
Students collect and classify items. In this making predictions lesson, students go outside and collect specimens of plants, insects and minerals. They classify each item and place them in a Venn Diagram. Students compare and contrast...
Raytheon
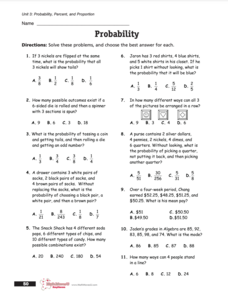
Probability, Percent, and Proportion
In this probability and predictions learning exercise, learners read 1 page of facts, then solve 8 pages of problems related to probability, with answers keys included.
Curated OER
Hands On: Make Predictions
In this making predictions activity, students use the line graph for marble numbers and colors to help them answer the questions about making predictions.
Mathalicious
XBOX Xpotential
Touchdown! This is an exponentially insightful lesson plan that explores the growth of football games with different video game consoles. Class members discuss whether the increase of mergahertz can be described as linear or...
Curated OER
Can You Measure Up?
Here is a well-designed lesson on common standards of measurement for your young mathematicians. In it, learners calculate measurements in standard and non-standard units. They make predictions, record data, and construct and design...
American Institutes for Research
Data and Probability: Marshmallow Madness
Upper grade and middle schoolers make predictions, collect data, and interpret the data as it relates to the concept of probability. They work with a partner tossing marshmallows and recording if they land on their side or on their...
Other popular searches
- Making Predictions Math
- Pumpkin Math Predictions
- Prediction Math
- Predictions Math
- Prediction Skills in Math
- Tsunami Prediction Math


