Inside Mathematics
Snakes
Get a line on the snakes. The assessment task requires the class to determine the species of unknown snakes based upon collected data. Individuals analyze two scatter plots and determine the most likely species for five additional data...
Curated OER
Scatter Plots
In this scatter plots worksheet, students solve and complete 4 different problems. First, they use the table shown to model the relation with a scatter plot and trend line and to predict the value of a variable when given the other...
EngageNY
More on Modeling Relationships with a Line
How do you create a residual plot? Work as a class and in small groups through the activity in order to learn how to build a residual plot. The activity builds upon previous learning on calculating residuals and serves as a precursor to...
CCSS Math Activities
Scatter Diagram
Don't let a great resource scatter to the winds. Pupils analyze two sets of test scores on a scatter plot. They draw a line of best fit and use it to make predictions about the test scores. They also consider any apparent trends in the...
West Contra Costa Unified School District
Correlation and Line of Best Fit
Computers are useful for more than just surfing the Internet. Pupils first investigate scatter plots and estimate correlation coefficients. Next, they use Microsoft Excel to create scatter plots and determine correlation coefficients and...
Curated OER
Scatter Plots
In this scatter plots worksheet, students solve and complete 6 different problems. First, they create a scatter plot to illustrate how weight and height are related and determine their relationship as positive, negative or no relation....
Inside Mathematics
House Prices
Mortgages, payments, and wages correlate with each other. The short assessment presents scatter plots for young mathematicians to interpret. Class members interpret the scatter plots of price versus payment and wage versus payment for...
Virginia Department of Education
Graphs
Examine different types of graphs as a means for analyzing data. Math scholars identify the type of graph from a series of data displays and then develop questions to match each one. Then, given a scatter plot of height versus age data,...
Curated OER
Fourteen Math Regent Exam Statistics Questions on Scatter Plots and Linear Regression
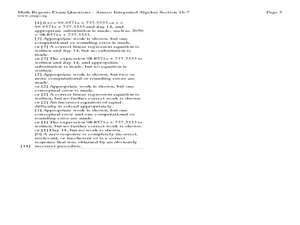
In this linear regression worksheet, students solve fourteen Math Regent Exam questions regarding scatter plots and linear regression. The solutions are provided.
Curated OER
Quiz: Scatter Plots and Line of Best Fit
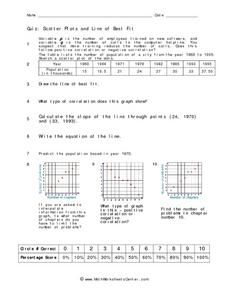
In this scatter plots and line of best fit worksheet, students create scatter plots from given sets of data. They answer questions concerning the scatter plot. Students write the equation of a line, identify the type of correlation...
EngageNY
Interpreting Correlation
Is 0.56 stronger than -0.78? Interpret the correlation coefficient as the strength and direction of a linear relationship between two variables. An algebra lesson introduces the correlation coefficient by estimating and then calculating it.
Statistics Education Web
Text Messaging is Time Consuming! What Gives?
The more you text, the less you study. Have classes test this hypothesis or another question related to text messages. Using real data, learners use technology to create a scatter plot and calculate a regression line. They create a dot...
Balanced Assessment
A Fishy Story
There's nothing fishy about this resource. In the task, learners use given information about fish prices to create a scatter plot and line of best-fit. Later, they use the information to answer questions about the profit from fish sales.
University of Utah
Statistics-Investigate Patterns of Association in Bivariate Data
Young mathematicians construct and analyze patterns of association in bivariate data using scatter plots and linear models. The sixth chapter of a 10-part eighth grade workbook series then prompts class members to construct and interpret...
Curated OER
Graphing and Analyzing
In this graphing and analyzing worksheet, 9th graders first state if each graph represents a linear or nonlinear relationship. Second, they create a difference table for each set of data presented and determine whether it represents a...
Balanced Assessment
Compact-Ness
Creating a definition may be easier than it sounds! Give your classes experience creating their own definition. Scholars examine the meaning of the compact-ness of a scatter plot and create their own definitions based on measurements.
Curated OER
Statistics
In this statistics worksheet, 9th graders solve and complete 10 various types of problems that include using different types of graphs to illustrate data. First, they determine the median score for each stem-and-leaf plot. Then, students...
EngageNY
Analyzing Residuals (Part 2)
Learn about patterns in residual plots with an informative math lesson. Two examples make connections between the appearance of a residual plot and whether a linear model is the best model apparent. The problem set and exit ticket...
Curated OER
Algebra I: Scatter Plots
In this scatter plot worksheet, students write an equation for a line that would fit the given scatter plot. They create scatter plots from given information. This two-page worksheet contains eight problems.
Curated OER
Data Analysis: Graphs, Charts, Tables, Statistics
In this data analysis worksheet, students interpret data in 5 problems involving graphs, tables, and scatterplots. Students construct 1 stem and leaf plot and find the mean, median, and mode of a data set.
Inside Mathematics
Archery
Put the better archer in a box. The performance task has pupils compare the performance of two archers using box-and-whisker plots. The resource includes sample responses that are useful in comparing individuals' work to others.
Curated OER
Practice: Word Problems
Congratulations, you've just hit the word problem jackpot! Covering an incredible range of topics from integers and fractions, to percents, geometry, and much more, this collection of worksheets will keep young mathematicians busy...
Curated OER
Scatterplots
In this statistics worksheet, learners create a scatter plot based on their analysis of data provided form the space shuttle Challenger disaster. The five page worksheet contains four questions. Answers are not provided.
Curated OER
Teen Pregnancy: Investigating Cubic Functions
In this teen pregnancy learning exercise, students use a scatter plot and cubic functions to solve word problems about teen pregnancy. Students complete 7 problems.


