Virginia Department of Education
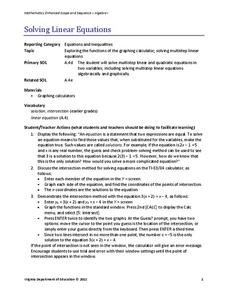
Solving Linear Equations
Practice solving linear equations by graphing. Scholars learn to solve multi-step linear equations in one variable by graphing both sides of the equation separately. They use graphing calculators to find the intersection of the graphs.
Curated OER
TE Activity: Testing the Caverns
Students make model caverns out of paper mache or clay. They bury them in a tray of sand, and test the models by dropping balls into them simulating as asteroid hitting the earth. They discuss the results of the activity in a whole class...
Curated OER
Timed Multiplication Test Graphs
Students use the tools of data analysis for managing information. They solve problems by generating, collecting, organizing, displaying histograms on bar graphs, circle graphs, line graphs, pictographs and charts. Students determine...
Curated OER
Prime Factorization
In this prime factorization worksheet, students solve 7 multiple choice problems. Students find the prime factorization of 91, 84, 78, 70, 67,63, and 36.
Curated OER
Critical Thinking Problems
Young mathematicians practice their reasoning as well as adding and subtracting skills with this worksheet that includes five simple word problems about birthdays. Learners are give pictures of birthday cakes and based on the number of...
Curated OER
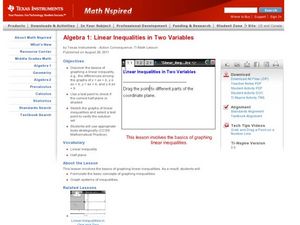
Linear Inequalities in Two Variables
Graph and solve linear equations in two variables. The class relates the concepts of linear equations to the real world.
Curated OER
TE Activity: A Tornado in My State?
Students study data about tornadoes in the United States while completing a worksheet. They develop a bar graph showing the number of tornadoes for the top ten states in the US. They find the median and mode of the data set.
Curated OER
Telling Time Lesson Plan
Judy Clocks are a great invention. Here, learners review telling time to hour and half hour on Judy clocks, begin telling time to quarter hour, use clock stamps to practice, and play computer games using Trudy's Time and Place House...
Curated OER
Attack of the Raging River
Students explore mass and volume. In this mass and volume lesson, students pretend to be on a hike and have lost their way. Students must cross a river get back on track. Students must use mass, volume, surface area, density, property...
Statistics Education Web
Walk the Line
How confident are you? Explore the meaning of a confidence interval using class collected data. Learners analyze data and follow the steps to determine a 95 percent confidence interval. They then interpret the meaning of the confidence...
West Contra Costa Unified School District
Introduction to Inverse Functions
Ready to share the beauty of the inverse function with your classes? This algebra II lesson guides the discovery of an inverse function through a numerical, graphical, and an algebraic approach. Connections are made between the three,...
Math Guy
Algebra 2 Practice Final
Work out to Algebra II with the 50-question learning exercise that practices different types of functions. Multiple choice questions focus on topics such as rational, radical, and logarithmic functions. The resource comes with a printed...
Kenan Fellows
Weight and Balance of an Airplane
A career in aeronautics might be calling your class members. Building from the previous two lessons in the series, learners continue analyzing the mathematics of aeronautics. Groups create a paper airplane using paperclips for balance....
Curated OER
How Long Can You Go?
Eighth graders examine the usefulness of a line of best fit by collecting and graphing data, using a graphing calculator to determine the line of best fit, and making a variety of predictions. They watch a video, then design a...
Agile Mind
Cake Weighing
An online set of four yummy questions addresses number sense for sixth graders. They place points on a number line, determine relative values, interpret absolute value, and apply their understanding to the weighing of cakes for a bakery....
Mathematics Assessment Project
Sorting Equations and Identities
Identify the identity. Learners first solve equations to find the number of solutions. Scholars then determine if given equations are always, sometimes, or never true, leading to the concept of identities.
American Statistical Association
How Fast Are You?
Quick! Snap up the activity. Scholars first use an online app to collect data on reaction times by clicking a button when the color of a box changes. They then plot and analyze the data by considering measures of center, measures of...
Curated OER
Yummy Gummy Subtraction
Here is a quick 15 minute lesson intended to introduce subtraction. Learners count and subtract gummy bears to complete 5 problems. The lessons suggest that the gummy bears can be saved and used the next day, but gummy bears get gross...
American Statistical Association
Don't Spill the Beans!
Become a bean counter. Pupils use a fun activity to design and execute an experiment to determine whether they can grab more beans with their dominant hand or non-dominant hand. They use the class data to create scatter plots and then...
American Statistical Association
Exploring Geometric Probabilities with Buffon’s Coin Problem
Scholars create and perform experiments attempting to answer Buffon's Coin problem. They discover the relationships between geometry and probability, empirical and theoretical probabilities, and area of a circle and square.
Kentucky Department of Education
Multi-Digit Multiplication Strategies
There is more than one way to solve a multiplication problem, and many learners find that the lattice multiplication method can be a helpful one. Fourth graders take an initial formative assessment before working in groups of two or...
Curated OER
Place Value - What Is the Value of the Place?
Second graders build number sense in an activity that requires the matching of base 10 representations to numbers. It is the teachers responsibility to gauge student understanding and involvement while class members work in groups.
EngageNY
Estimating Probability Distributions Empirically 2
Develop probability distributions from simulations. Young mathematicians use simulations to collect data. They use the data to draw graphs of probability distributions for the random variable in question.
Curated OER
Conditional Probability and Probability of Simultaneous Events
Your statisticians examine the characteristics of conditional probability and the probability of simultaneous independent events. They perform computer activities to find probabilities for simple compound events. They examine the...


