Curated OER
Graphing
Students investigate graphing. In this bar graph lesson plan, students view an informational website about graphing, then construct a class birthday bar graph outside with sidewalk chalk. Students choose a survey topic, then...
Curated OER
Survey and Tally
Second graders view a model of a survey and tally. In this survey and tally instructional activity, 2nd graders decide on questions for a survey. Students conduct the survey and tally their results. Students create a...
Curated OER
Free Standing Structures
Students investigate how to create a free standing structure. In this mathematics lesson, small groups of students demonstate how to build the tallest structure while spending the least amount of money on materials.
Curated OER
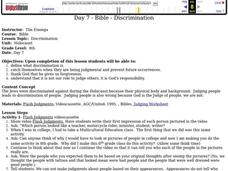
Discrimination
Seventh graders discuss the origin of discrimination and the Holocaust. In this Bible lesson, 7th graders define discrimination and discuss if they have discriminated or not. They thank God for forgiveness and realize it is no ones role...
Curated OER
Everyday Objects with Shapes
Young scholars explore geometric shapes. In this geometry and language development instructional activity, students take a walk and look for shapes in the objects outdoors. Young scholars match each of four individual ...
Curated OER
Exploring Area and Perimeter
Two students are blindfolded and each receives a cardboard square, one with pompoms glued around the edge and one with pompoms glued all over the surface. They identify what they feel. The class discusses perimeter and area of polygons....
Curated OER
Which Number Will Finish First?
Students conduct probability experiments. in this number instructional activity, students use spinners and conduct probability experiments. They collect and organize data on talley sheets.
Curated OER
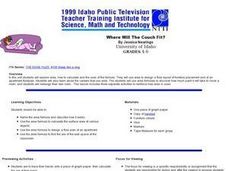
Where Will The Couch Fit?
Students name the area formula and describe how it works. They use area formula to calculate the surface area of various objects. They use the area formula to design a floor plan of an apartment.
Curated OER
Range, Mean, Median, and Mode
Eighth graders find the range, median, mean, and mode of a data set. In this finding the range, median, mean, and mode of a data set lesson plan, 8th graders collect data about the high and low temperature for 10 different...
Curated OER
Contaminated Drinking Water
Students predict, experiment, and draw conclusions about the safety of drinking water. In this ecology lesson, students participate in an experiment to determine if they can taste or see contamination in drinking water. Data is collected...
Curated OER
What Does Average Look Like?
Fifth graders explore the concepts of range, median, mode, and mean through the use of graphs drawn from models. They use manipulatives to represent data they have collected within their groups, and compare the differences between mode,...
Curated OER
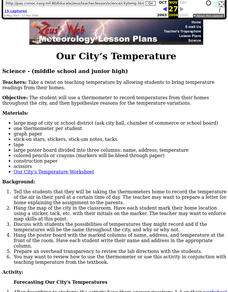
Our City's Temperature
Students use a thermometer to record temperatures from their homes throughout the city, and then hypothesize reasons for the temperature variations. They use a weather graph worksheet that's imbedded in this lesson to orgainize their data.
Curated OER
Ranging the Triple M's
Fifth graders explore collecting and analyzing data. In this mean, median and mode activity, 5th graders use real word data to determine the mean, median and mode. Students are given sets of numbers on index cards as asked to find the...
Curated OER
Multiple Patterns
Second graders utilize a 1-100 grid to identify multiples of single digit numbers. They look for patterns and how they could be used to identify multiples to demonstrate the ability to use the multiplication facts and charts of single...
Curated OER
Surface area of a cylinder
Students construct a cylinder made of paper with detachable bases. Then they are taught the formulas for finding the area of a curved surface and the total surface area of a cylinder. A great hands-on approach!
Curated OER
Are Colleges Still Affordable?
Young scholars investigate mathematical model that compares cost of higher education to potential earnings in order to decide if the investment is a good one. They compute amount to be repaid each year for the life of a student loan and...
Curated OER
Valentine Hearts Investigation
Students practice analyzing data and making predictions. In this 2nd - 3rd grade lesson plan, students investigate and compare data gathered using boxes of valentine candy hearts. Students examine the different boxes of candy provided,...
Curated OER
Be the Kiwi
Young scholars analyze linear equation. In this algebra lesson, students analyze and graph data. They solve problems involving linear equations and graph lines using the slope and y intercept.
Curated OER
Patterns
Second graders work with different types of patterns. In this pattern activity, 2nd graders go to a pattern block webpage and use Unifix cubes to create their own patterns. They find patterns in the real world and draw their own...
Curated OER
It's In The Chocolate Chips
Students investigate which brand of chocolate chip cookies contains the most chocolate. They analyze and compare data using Microsoft Word and Microsoft Excel. They communicate the results with Microsoft PowerPoint.
Curated OER
ELECTRICITY 1
Fifth graders examine the importance of electricity to their everyday lives, practice plotting and interpreting data on a bar graph, and reflect in their journals about how their lives would change without electricity.
Curated OER
Proportions
Students perform mathematical operations to create proportional measurements, after listening to the David Schwartz book, If You Hopped Like a Frog.
Curated OER
Raising the Bar While Hogging the Ham (Radio, That Is)
Young scholars watch a Cyberchase video to determine the importance of using the correct scale when making bar graphs. They examine how to use bar graphs to gain information easily. They determine how to use bar graphs persuasively.
Curated OER
Teddy Bear Picnic
Students sit in a circle with their bears from home, each child introduces their bear, then students examine all the bears and think of one way that they can be sorted.


