Bowland
AstroZoo
Rescue animals in the zoo by applying math concepts. Groups of learners solve three missions involving oxygen, food, and climate control. Each group selects an animal from one of four bio-domes.
Bowland
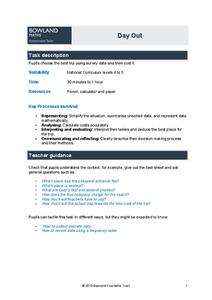
Day Out
Use mathematics to help plan a field trip. Scholars use the results of a survey to determine where a class should go on a field trip. They use provided data about entrance fees and mileage to calculate the cost per person of such a trip.
Bowland
Olympic Cycling
Teach teenagers to think critically about data. Young data analysts must create two questions that can be answered using a provided data set on Olympic cycling times. Of course, they then have to answer their questions using mathematics.
Mathed Up!
Angles in Polygons
Show your class that finding angle measures is a regular calculation with a resource that provides 12 problems dealing with the measures of angles in regular polygons. Pupils use formulas for the sum of measures of angles in a polygon to...
Statistics Education Web
It Creeps. It Crawls. Watch Out For The Blob!
How do you find the area of an irregular shape? Class members calculate the area of an irregular shape by finding the area of a random sampling of the shape. Individuals then utilize a confidence interval to improve accuracy and use a...
Mathematics Vision Project
Module 1: Getting Ready Module
This fabulous resource is a must-have for any algebra teacher's arsenal of lessons. Developing the idea of equations and use of variables from basic physical scenarios, learners gain valuable intuition in the structure and meaning of...
Illustrative Mathematics
The Lighthouse Problem
Long considered the symbol of safe harbor and steadfast waiting, the lighthouse gets a mathematical treatment. The straightforward question of distance to the horizon is carefully presented, followed by a look into the different...
Math Worksheets Land
Zombie's Mean, Median, Mode, and Range
Given four sets of data, zombie-loving mathematicians find the mode, range, mean, and median for each set. The sheet is more challenging if calculators are not used; but the data set with large numbers may require a calculator.
University of Adeaide
Basic Trigonometry and Radians
A fabulous set of examples and problems that introduce basic trigonometry concepts, this packet is set apart by the care it takes to integrate both radians and degrees into the material. After defining radians, the author demonstrates...
Shodor Education Foundation
Stem and Leaf Plotter
The key is in the leaves. Pupils enter data to create a stem-and-leaf plot. The resource then displays the plot and calculates the mean, median, and mode of the data. Using the plot and the calculated measures of spread, learners analyze...
Illustrative Mathematics
Doctor's Appointment
Geometric volume calculations are brought into the real world in a quick set of application problems. Learners are asked to help a patient figure out how to drink a prescribed amount of water both at work and at home. This activity...
Statistics Education Web
What Percent of the Continental US is Within One Mile of a Road?
There are places in the US where a road cannot be found for miles! The lesson asks learners to use random longitude and latitude coordinates within the US to collect data. They then determine the sample proportion and confidence interval...
CK-12 Foundation
Expected Value: Game of Chance
Determine whether the payoff is worth it. Pupils calculate the expected value of a game with three different payoff levels. Each level has a different probability of winning money. The scholars find the expected payoffs for each level...
National Council of Teachers of Mathematics
Scale Factor
Does doubling mean everything doubles? Learners adjust the scale factor between two rectangles. Using the calculated measurements, pupils investigate the ratios between the lengths, perimeters, and areas of the rectangles.
CK-12 Foundation
Variance of a Data Set
Use variable value sliders to understand variance. The interactive shows four whole numbers, their mean and deviation. Using the information, pupils find the variance of the numbers and respond to question related to the understanding of...
Shodor Education Foundation
Graphit
No graphing calculator? No worries, there's an app for that! Young mathematicians use an app to graph functions. In addition, they can also plot data points.
College Board
So Much Data, So Little Time
Organizing data in a statistics class is often a challenge. A veteran statistics teacher shares data organization tips in a lesson resource. The instructor shows how to group data to link to individual calculators in a more efficient...
Bowland
Soft Drinks
"Statistics are no substitute for judgment" - Henry Clay. Young mathematicians use provided statistics from a soda taste test to explain why conclusions are faulty. They devise a new test that would be more appropriate than the one given.
101 Questions
Dandy Candies
Package design is an economic necessity. Young scholars assume the role in an interesting inquiry-based lesson. Given 24 cubic shaped candies to package, they must determine the arrangement that uses the least amount of cardboard to...
Concord Consortium
Full of Beans
Scholars have an opportunity to use their geometric modeling skills. Pupils determine a reasonable estimate of the number of string beans that would fill the average human body.
BW Walch
Solving Systems of Linear Equations
Solving systems of equations underpins much of advanced algebra, especially linear algebra. Developing an intuition for the kinds and descriptions of solutions is key for success in those later courses. This intuition is exactly what...
West Contra Costa Unified School District
Introduction to Trigonometric Functions
Scholars first learn the definitions of the sine ratio, the cosine ratio, and the tangent ratio. After mastering these definitions, they use the new information to solve triangles.
Bytes Arithmetic
Geometry Pad+
Graphing paper, pencil, ruler, protractor, and compass, all get replaced or supplemented with this dynamic geometry application. Here, you can create, move, and scale many different shapes, as well as, explore and change their properties...
Statistics Education Web
The Case of the Careless Zookeeper
Herbivores and carnivores just don't get along. Using a box of animal crackers, classes collect data about the injury status of herbivores and carnivores in the box. They complete the process of chi-square testing on the data from...


