CK-12 Foundation
Normal Approximation of the Binomials Distribution: When to Approximate
Normalizing a binomial distribution — determine when it is all right. Given the rule of thumb of when it is appropriate to use the normal distribution to approximate a binomial distribution, pupils look at different scenarios. Scholars...
CK-12 Foundation
Angle Measurement: Fuel Gauge Angles
Once you start looking, angles appear everywhere in our daily lives. A creative lesson has learners use the angles created by a fuel gauge to practice the Angle Addition Postulate. They see how changing the angle parts does not change...
CK-12 Foundation
Understand and Create Histograms: Histograms
Determine the shape of weight. Using the interactive, class members build a histogram displaying weight ranges collected in a P.E. class. Scholars describe the shape of the histogram and determine which measure of central tendency to use...
CK-12 Foundation
Stratified Random Sampling: An Extracurricular Study
Learning isn't a random process. A well-designed interactive lesson helps classes make key conclusions about stratified random sampling. They calculate group percentages and use those percentages to decide on sampling totals.
CK-12 Foundation
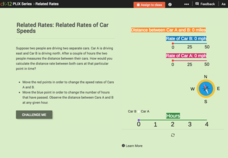
Related Rates of Car Speeds
Speed up your pupils' understanding of derivatives. Two cars travel in perpendicular distances to each other. With the aid of the interactive, learners visualize the situation. Pupils use the derivative to calculate the instantaneous...
CK-12 Foundation
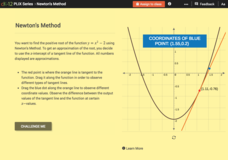
Newton's Method
Use an iterative process to find an approximation of a square root. Pupils use the interactive to find an approximation to find the positive root of a quadratic function with Newton's method. With the graphs, learners position the...
CK-12 Foundation
Work and Force: Lifting a Bucket
How much work does it take to lift a bucket? An interactive presents a problem of lifting a bucket from the ground to the top of a building. Using their knowledge about work and integrals, pupils calculate the amount of work required to...
CK-12 Foundation
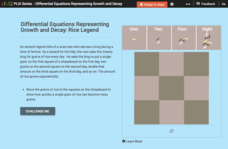
Differential Equations Representing Growth and Decay: Rice Legend
The legend of a wise man who asks a king for rice as a reward presents a context to study exponential solutions to differential equations. Pupils move quantities of rice to a chessboard and calculate the amount of rice for each day. To...
CK-12 Foundation
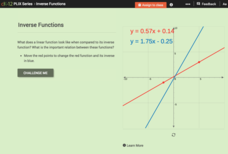
Inverse Functions
Provide a graphical view of inverses. Pupils manipulate points on a line and see the relationship of the graph with the graph of its inverse. Using the relationship between the graphs, scholars respond to questions concerning inverses...
CK-12 Foundation
Ellipses: The Ellipse
Learners explore ellipses by changing the lengths and orientation of the major and minor axis. Using the interactive, they determine the equation of the ellipse and its eccentricity. Given an equation the scholars identify the center,...
CK-12 Foundation
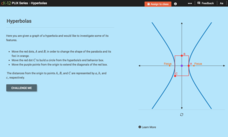
Hyperbolas
Hyperbolas—practice thinking outside of the box. Pupils alter the end behavior box to create various graphs of hyperbolas. They determine formulas to find the distance from the origin to the foci. Using that information, scholars...
CK-12 Foundation
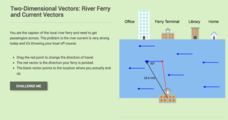
Two-Dimensional Vectors: River Ferry and Current Vectors
Fight against the current. Pupils explore the resulting path when they are crossing a river while being pushed downstream by the current. Using vector notation, learners express the speed and direction of a ferry. They finish by...
Shodor Education Foundation
InteGreat!
Take a great look at integration! Young scholars use an interactive to learn how to integrate a function. Learners input a function and view the integral as well as see a graphical representation.
CCSS Math Activities
Satellite
This isn't rocket science, you know. A performance task has learners use right triangle trigonometry to calculate distances from stations on Earth to a satellite. It also requires finding the distance between two stations along the...
Shodor Education Foundation
Measures
Take a look at data from a statistical lens. An interactive allows pupils to enter data set, labeling the data including the units used. Manipulating the applet, learners select the statistics to calculate that include total, mean,...
Illustrative Mathematics
The Escalator, Assessment Variation
A great way to practice with unit rates, the activity gives your mathematicians an opportunity to compare different statements and select which are true. They can practice with "choose all that apply" by setting each statement into its...
Illustrative Mathematics
Giantburgers
What is a million between friends? This fast food chain claims to serves a certain percentage of Americans every day. The resource agrees, but depending on how you calculate it, you could be a million off. Let your fast food munchers be...
Annenberg Foundation
Skeeters Are Overrunning the World
Skeeters are used to model linear and exponential population growth in a wonderfully organized lesson plan including teachers' and students' notes, an assignment, graphs, tables, and equations. Filled with constant deep-reaching...
Stats Monkey
Everything I Ever Needed to Learn about AP Statistics I Learned from a Bag of M and M's®
Candy is always a good motivator! Use this collection of M&M's® experiments to introduce statistics topics, including mean, standard deviation, nonlinear transformation, and many more. The use of a hands-on model with these AP...
Mt. San Antonio Collage
Quiz 1: Functions, Domain and Range
Take the work out of worksheets and use these problems and worked-out answer key as a resource. The problems reinforce skills in domain and range, identifying graphs, and even and odd functions.
Willow Tree
Interior Angles, Exterior Angles, and Diagonals of Polygons
How does the number of sides of a polygon affect the angle measures? Learners recognize a pattern in finding the total measure of interior and exterior angles and the number of diagonals. They use the patterns to calculate the number of...
Willow Tree
Line Graphs
Some data just doesn't follow a straight path. Learners use line graphs to represent data that changes over time. They use the graphs to analyze the data and make conclusions.
Mathematics Assessment Project
Skeleton Tower
Who doesn't like building blocks? In the task, pupils use a given diagram of a tower to determine the number of needed blocks. Using this information, pupils then develop a function rule relating the height of the tower to the number of...
Mathematics Assessment Project
Fearless Frames
Show class members how to connect algebra to geometry. A high school assessment task has pupils determine volumes of two different containers given limitations on material for box frames. Pupils then write a paragraph on advice people...


