EngageNY
Properties of Dilations
Investigate dilations to learn more about them. The second segment in a series of 16 provides a discussion of properties of dilations by going through examples. The problem set provides opportunities for scholars to construct dilations.
EngageNY
Informal Proof of AA Criterion for Similarity
What does it take to show two triangles are similar? The 11th segment in a series of 16 introduces the AA Criterion for Similarity. A discussion provides an informal proof of the theorem. Exercises and problems require scholars to apply...
EngageNY
Patterns in Scatter Plots
Class members investigate relationships between two variables in the seventh installment of a 16-part module that teaches scholars how to find and describe patterns in scatter plots. Young mathematicians consider linear/nonlinear...
EngageNY
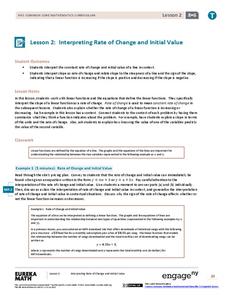
Interpreting Rate of Change and Initial Value
Building on knowledge from the previous lesson plan, the second lesson plan in this unit teaches scholars to identify and interpret rate of change and initial value of a linear function in context. They investigate how slope expresses...
EngageNY
Association Between Categorical Variables
Investigate associations between variables with two-way tables. Scholars continue their study of two-way tables and categorical variables in the 15th installment of a 21-part module. The lesson plan challenges them to calculate relative...
EngageNY
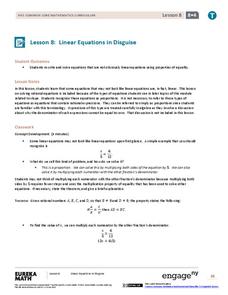
Linear Equations in Disguise
In the eighth segment of a 33-part unit, learners look at equations that do not appear to be linear at first glance. The equations are proportions where the numerators and denominators may have more than one term. To round out the...
EngageNY
Examples of Functions from Geometry
Connect functions to geometry. In the ninth installment of a 12-part module, young mathematicians create functions by investigating situations in geometry. They look at both area and volume of figures to complete a well-rounded lesson.
EngageNY
The Decimal Expansion of Some Irrational Numbers
Develop a definition of irrational numbers through an exploration of square roots. The 11th instructional activity in this series of 25 asks scholars to estimate the value of a square root. Learners observe as the estimation extends...
EngageNY
Comparing Irrational Numbers
Build on your classes' understanding of irrational numbers by comparing their values. The 13th lesson in the 25-part module has individuals estimate values of both perfect and non-perfect roots. They finish by graphing these numbers on a...
EngageNY
An Exercise in Creating a Scale Drawing
Design your dream classroom. The lesson plan contains an exercise to have teams create a scale drawing of their dream classroom. Pairs take the measurements of their classroom and furniture and create a scale factor for them. To finish...
EngageNY
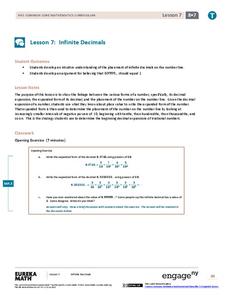
Infinite Decimals
Can you support the argument that the decimal 0.99999 ... is equivalent to the number one? The seventh installment in this 25-part module gives convincing support for this conclusion. Pupils write infinite decimals using powers of 10....
EngageNY
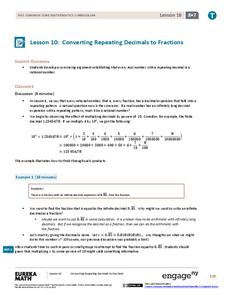
Converting Repeating Decimals to Fractions
Develop a process with your classes for converting repeating decimals to fractions. Through this process, pupils understand that any repeating decimal can be written as a fraction. The 10th lesson in this 25-part module helps reinforce...
EngageNY
Why Worry About Sampling Variability?
Are the means the same or not? Groups create samples from a bag of numbers and calculate the sample means. Using the sample means as an estimate for the population mean, scholars try to determine whether the difference is real or not.
EngageNY
Comparing Quantities with Percent
Be 100 percent confident who has the most and by how much. Pupils use percentages to help make the comparisons by finding what percent one quantity is of the other. They also determine the percent differences between the two quantities.
EngageNY
Random Sampling
Sample pennies to gain an understanding of their ages. The 16th installment of a 25-part series requires groups to collect samples from a jar of pennies. Pupils compare the distribution of their samples with the distribution of the...
EngageNY
Equivalent Ratios
Equivalent ratios show up on tape. Young mathematicians use tape diagrams to create equivalent ratios in the initial lesson on the topic. They learn the definition of equivalent ratios and use it to build others in the third segment of a...
EngageNY
The Order of Operations
Future mathematicians learn how to evaluate numerical expressions by applying the order of operations. They evaluate similar-looking expressions to see how the location of parentheses and exponents affects the value.
EngageNY
The Mean Absolute Deviation (MAD)
Is there a way to measure variability? The ninth resource in a series of 22 introduces mean absolute deviation, a measure of variability. Pupils learn how to determine the measure based upon its name, then they use the mean absolute...
EngageNY
Summarizing a Distribution Using a Box Plot
Place the data in a box. Pupils experiment with placing dividers within a data set and discover a need for a systematic method to group the data. The 14th lesson in a series of 22 outlines the procedure for making a box plot based upon...
EngageNY
Summarizing a Data Distribution by Describing Center, Variability, and Shape
Put those numbers to work by completing a statistical study! Pupils finish the last two steps in a statistical study by summarizing data with displays and numerical summaries. Individuals use the summaries to answer the statistical...
EngageNY
Displaying a Data Distribution
Pupils analyze a display of data and review dot plots to make general observations about the highest, lowest, common, and the center of the data. To finish, learners match dot plots to scenarios.
Santa Barbara City College
How to Make a Multiplication Table
Teach children how to make a multiplication table, and they'll be multiplying for life. Following this series of steps, young mathematicians learn to use patterns and the relationships between numbers to create their very own...
EngageNY
Matrix Addition Is Commutative
Explore properties of addition as they relate to matrices. Using graphical representations of vector matrices, scholars test the commutative and associative properties of addition. They determine if the properties are consistent for...
EngageNY
Tangent Segments
What's so special about tangents? Learners first explore how if a circle is tangent to both rays of an angle, then its center is on the angle bisector. They then complete a set of exercises designed to explore further properties and...


