EngageNY
Properties of Logarithms
Log the resource on logarithms for future use. Learners review and explore properties of logarithms and solve base 10 exponential equations in the 12th installment of a 35-part module. An emphasis on theoretical definitions and...
EngageNY
Designing Your Own Game
Your classes become video game designers for a day! They utilize their matrices, vectors, and transformation skills to create and design their own game images. The complex task requires learners to apply multiple concepts to create their...
EngageNY
Determining Discrete Probability Distributions 1
Learn how to determine a probability distribution. In the ninth installment of a 21-part module, future mathematicians use theoretical probabilities to develop probability distributions for a random variable. They then use these...
EngageNY
Graphs of Linear Functions and Rate of Change
Discover an important property of linear functions. Learners use the slope formula to calculate the rates of change of linear functions. They find that linear functions have constant rates of change and use this property to determine if...
EngageNY
Modeling with Inverse Trigonometric Functions 1
Where should I stand to get the best view? Pupils use inverse trigonometric functions to determine the horizontal distance from an object to get the best view. They round out the lesson by interpreting their answers within context.
EngageNY
Operations with Numbers in Scientific Notation
Demonstrate the use of scientific notation within word problems. The instructional activity presents problems with large numbers best represented with scientific notation. Pupils use these numbers to solve the problems in the 11th...
EngageNY
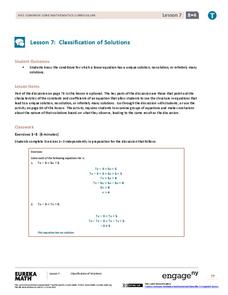
Classification of Solutions
Is there one, none, or more? Through discussion or activity, scholars find the properties of an equation that will determine the number of solutions. They then use the properties discovered to figure out the number of solutions...
EngageNY
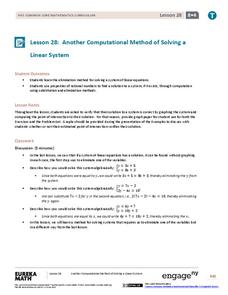
Another Computational Model of Solving a Linear System
The process of elimination really works! Use elimination when substitution isn't doing the job. The 29th segment in a series of 33 introduces the elimination method to solving linear systems. Pupils work several exercises to grasp the...
EngageNY
Every Line is a Graph of a Linear Equation
Challenge the class to determine the equation of a line. The 21st part in a 33-part series begins with a proof that every line is a graph of a linear equation. Pupils use that information to find the slope-intercept form of the...
EngageNY
Using Sample Data to Compare the Means of Two or More Populations II
The 23rd segment in a series of 25 presents random samples from two populations to determine whether there is a difference. Groups determine whether they believe there is a difference between the two populations and later use an...
EngageNY
From Ratio Tables to Equations Using the Value of a Ratio
Use the value of a ratio to set up equations. The teacher leads a discussion on determining equations from ratio tables in the 13th portion of a 29-part series. Pupils determine which of two equations to use to find the solution....
EngageNY
Interpreting and Computing Division of a Fraction by a Fraction—More Models II
No more inverting and multiplying to divide fractions. Applying concepts of measurement division from the previous instructional activity, pupils consider partitive division using fraction bars and number lines. They first convert...
EngageNY
Even and Odd Numbers
Even or not, here I come. Groups investigate the parity of products and sums of whole numbers in the 17th lesson in a series of 21. Using dots to represent numbers, they develop a pattern for the products of two even numbers; two odd...
EngageNY
Comparing Integers and Other Rational Numbers
The ninth installment of a 21-part module has pupils compare integers and rational numbers in decimal and fraction form. They match stories to number lines and compare values in the stories.
EngageNY
Describing Center, Variability, and Shape of a Data Distribution from a Graphical Representation
What is the typical length of a yellow perch? Pupils analyze a histogram of lengths for a sample of yellow perch from the Great Lakes. They determine which measures of center and variability are best to use based upon the shape of the...
Curated OER
Affine Recurrence Plotter
Learners use the on-line affine recurrence plotter to graph equations. They work on-line to create graphs of trout in a trout pond and savings account balances when interest is compounded over time. Links to the four one-day lessons are...
Curated OER
Learn to Earn When you Tend to Spend
Analyzing and understanding word problems is extremely important. Pupils learn that in money problems, earn usually means you add and spend usually means you subtract. They will solve a series of money-related word problems, label coins,...
EngageNY
Definition and Properties of Volume
Lead a discussion on the similarities between the properties of area and the properties of volume. Using upper and lower approximations, pupils arrive at the formula for the volume of a general cylinder.
EngageNY
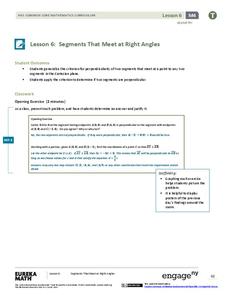
Segments That Meet at Right Angles
Can segments be considered perpendicular if they don't intersect? Learners look at nonintersecting segments on the coordinate plane and make conclusions about the lines that contain those segments. They determine if they are...
EngageNY
Secant Lines; Secant Lines That Meet Inside a Circle
Young mathematicians identify different cases of intersecting secant lines. They then investigate the case where secant lines meet inside a circle.
EngageNY
Construct a Perpendicular Bisector
How hard can it be to split something in half? Learners investigate how previously learned concepts from angle bisectors can be used to develop ways to construct perpendicular bisectors. The resource also covers constructing a...
EngageNY
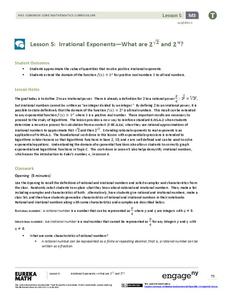
Irrational Exponents—What are 2^√2 and 2^π?
Extend the concept of exponents to irrational numbers. In the fifth installment of a 35-part module, individuals use calculators and rational exponents to estimate the values of 2^(sqrt(2)) and 2^(pi). The final goal is to show that the...
EngageNY
Building Logarithmic Tables
Thank goodness we have calculators to compute logarithms. Pupils use calculators to create logarithmic tables to estimate values and use these tables to discover patterns (properties). The second half of the lesson has scholars use given...
EngageNY
Counting Rules—The Fundamental Counting Principle and Permutations
Count the benefits of using the resource. The second installment of a 21-part module focuses on the fundamental counting principle to determine the number of outcomes in a sample space. It formalizes concepts of permutations and...
Other popular searches
- History of Mathematics
- Discrete Mathematics
- Mathematics Line Symmetry
- Everyday Mathematics
- Montessori Mathematics
- Writing in Mathematics
- Mathematics Mode and Median
- Applied Mathematics
- Mathematics Times Tables
- Christmas Mathematics
- B Ed Mathematics
- Discrete Mathematics Graph


