Curated OER
Time Basics Review
In this basic mathematics worksheet, students identify the basics of telling time. They read a watch and figure out three hours later from that time. Students also write the times given using both words and numbers for each watch shown.
Curated OER
History and the Approximations of pi
Middle schoolers investigate Pi. In this mathematics lesson, learners discuss the history of Pi and determine how the approximation of Pi was discovered.
PwC Financial Literacy
Buying a Home: Terms of a Mortgage
Buying a home, dealing with a lender, securing a mortgage; these are daunting tasks for many adults. Why not teach middle schoolers about this area of adulthood so they are better-prepared to make the leap into home ownership when they...
National Wildlife Federation
Get Your Techno On
Desert regions are hotter for multiple reasons; the lack of vegetation causes the sun's heat to go straight into the surface and the lack of moisture means none of the heat is being transferred into evaporation. This concept, and other...
National Wildlife Federation
Why All The Wiggling on the Way Up?
Some of the CO2 emitted by burning fossil fuels is removed from the atmosphere by natural sinks, such as the ocean. The fifth engaging lesson in the series of 21 examines the CO2 data from three very different locations. It then makes a...
National Wildlife Federation
Quantifying Land Changes Over Time in Areas of Deforestation and Urbanization
Is qualitative or quantitative research more convincing when it comes to climate change? In the eighth lesson during this 21-part series, scholars begin by performing a quantitative analysis of deforestation and urbanization. Then, they...
National Wildlife Federation
Ghost Town
Around 93 percent of the reefs on Australia's Great Barrier Reef have been bleached, and almost one quarter of them are now dead. Scholars research the sea temperatures, especially around the areas with coral reefs, to make connections...
National Wildlife Federation
What is DBH?
When measuring the circumference of a tree, does it matter how high you place the measuring tape? Most scholars have never considered this question, but scientists know that measurement techniques must be standardized. The 13th...
National Wildlife Federation
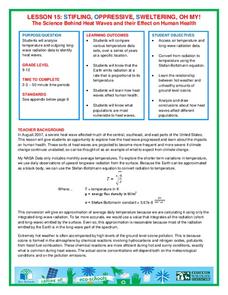
Stifling, Oppressive, Sweltering, Oh My!
Looking for a hot date? Pick any day in August, statistically the hottest month in the United States. The 15th lesson in the series of 21 instructs pupils to investigate the August 2007 heat wave through NASA data, daily temperature...
National Wildlife Federation
When It Rains It Pours More Drought and More Heavy Rainfall
Which is worse — drought or flooding? Neither is helpful to the environment, and both are increasing due to climate change. The 16th instructional activity in a series of 21 covers the average precipitation trends for two different...
National Wildlife Federation
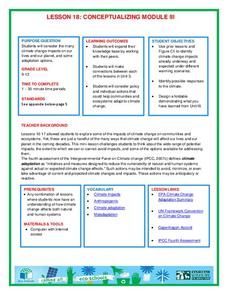
Conceptualizing Module III
Many researchers focus on one impact of climate change in isolation, but researchers gain a global perspective when they come together. A timely lesson teaches scholars about the projected impacts of global temperature increases. Then...
National Wildlife Federation
I’ve Got the POWER! Solar Energy Potential at Your School
Should every school have solar panels? The 19th lesson in a series of 21 has scholars research the feasibility of using solar panels at their school. They begin by gathering data on the solar energy in the area before estimating the...
National Wildlife Federation
I’ve Got the POWER Wind Energy Potential at Your School
The 20th lesson in a 21-part series connects the wind data and expectations of a turbine to whether such devices should be built in your area. Scholars begin with estimating the wind potential at school by using long-term climate data...
National Wildlife Federation
Climate Solutions – A Call to Action!
The final lesson in the 21-part series on climate change focuses on energy solutions to the consumption problem. Using data specific to their school, pupils make recommendations, follow up on actions, and carefully track progress....
National Wildlife Federation
Green Green Revolution
School budgets don't have a lot of extra money, so when students propose saving the district money, everyone jumps on board. The first lesson in the series of 21 introduces the concept of an energy audit. Scholars form an eco-action team...
National Wildlife Federation
Wherefore Art Thou, Albedo?
In the sixth lesson in a series of 21, scholars use NASA data to graph and interpret albedo seasonally and over the course of multiple years. This allows learners to compare albedo trends to changes in sea ice with connections to the...
National Wildlife Federation
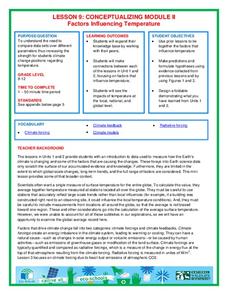
Conceptualizing Module II - Putting It All Together
"Creativity is just connecting things." - Steve Jobs. After weeks of researching climate change, the ninth lesson in a series of 21 combines the data and analysis to address essential questions. It covers natural phenomenon, human...
National Wildlife Federation
I Speak for the Polar Bears!
Climate change and weather extremes impact every species, but this lesson focuses on how these changes effect polar bears. After learning about the animal, scholars create maps of snow-ice coverage and examine the yearly variability and...
National Wildlife Federation
Citizen Science to the Rescue!
You don't have to be a scientist or even out of high school to contribute to scientific research. In the 12th lesson in the series of 21, scholars use this opportunity to add to the growing body of scientific knowledge and consider the...
National Wildlife Federation
Quantifying Land Changes Over Time Using Landsat
"Humans have become a geologic agent comparable to erosion and [volcanic] eruptions ..." Paul J. Crutzen, a Nobel Prize-winning atmospheric chemist. Using Landsat imagery, scholars create a grid showing land use type, such as urban,...
National Wildlife Federation
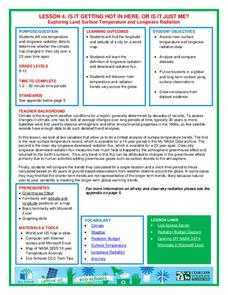
Is It Getting Hot in Here, or Is It Just Me?
Currently, only 2.1% of global warming is felt on continents, while over 93% is felt in the oceans. The fourth lesson in the series of 21 on global warming is composed of three activities that build off one another. In the first...
National Wildlife Federation
The Tide is High, but I’m Holding On… Using ICESat Data to Investigate Sea Level Rise
Based on the rate of melting observed from 2003-2007 in Greenland, it would take less than 10 minutes to fill the Dallas Cowboys' Stadium. The 17th activity in a series of 21 has scholars use the ICESat data to understand the ice mass...
Curated OER
Mathematics: Best Salary
Sixth graders pretend to need jobs to earn money for a go-cart which costs $1,000. They predict which of two scenarios raise the money first. they construct charts and graphs to demonstrate their predictions.
Curated OER
Justifying Mathematical Conjectures
Sixth graders, in groups, explain why they think something. This requires students to listen to and respond to each other. In this particular lesson, 6th graders explain to their classmates when one can or cannot construct a specific...
Other popular searches
- History of Mathematics
- Discrete Mathematics
- Mathematics Line Symmetry
- Everyday Mathematics
- Montessori Mathematics
- Writing in Mathematics
- Mathematics Mode and Median
- Applied Mathematics
- Mathematics Times Tables
- Christmas Mathematics
- B Ed Mathematics
- Discrete Mathematics Graph


