EngageNY
Using Expected Values to Compare Strategies
Discover how mathematics can be useful in comparing strategies. Scholars develop probability distributions for situations and calculate expected value. They use their results to identify the best strategy for the situation.
EngageNY
Positive and Negative Numbers on the Number Line—Opposite Direction and Value
Make your own number line ... using a compass. The first installment of a 21-part series has scholars investigate positive and negative integers on a number line by using a compass to construct points that are the same distance from zero...
EngageNY
Distributions and Their Shapes
What can we find out about the data from the way it is shaped? Looking at displays that are familiar from previous grades, the class forms meaningful conjectures based upon the context of the data. The introductory lesson to descriptive...
EngageNY
Analyzing Residuals (Part 1)
Just how far off is the least squares line? Using a graphing calculator, individuals or pairs create residual plots in order to determine how well a best fit line models data. Three examples walk through the calculator procedure of...
EngageNY
The Most Important Property of Logarithms
Won't the other properties be sad to learn that they're not the most important? The 11th installment of a 35-part module is essentially a continuation of the previous lesson, using logarithm tables to develop properties. Scholars...
EngageNY
Geometric Sequences and Exponential Growth and Decay
Connect geometric sequences to exponential functions. The 26th installment of a 35-part module has scholars model situations using geometric sequences. Writing recursive and explicit formulas allow scholars to solve problems in context.
EngageNY
Increasing and Decreasing Functions 2
Explore linear and nonlinear models to help your class build their function skills. In a continuation of the previous lesson, learners continue to analyze and sketch functions that model real-world situations. They progress from linear...
EngageNY
Interpreting Division of a Whole Number by a Fraction—Visual Models
Connect division with multiplication through the use of models. Groups solve problems involving the division of a whole number by a fraction using models. The groups share their methods along with the corresponding division and...
EngageNY
Creating a Dot Plot
Which dot am I? Pupils create dot plots to represent sample data through the use of frequency tables. The third segment in a series of 22 asks individuals to analyze the dot plots they created. The scholars translate back and forth...
EngageNY
Scale Factors
Is it bigger, or is it smaller—or maybe it's the same size? Individuals learn to describe enlargements and reductions and quantify the result. Lesson five in the series connects the creation of a dilated image to the result. Pupils...
EngageNY
Representing Reflections with Transformations
In the 16th lesson in the series of 32 the class uses the concept of complex multiplication to build a transformation in order to reflect across a given line in the complex plane. The lesson breaks the process of reflecting across a line...
EngageNY
The Geometric Effect of Multiplying by a Reciprocal
Class members perform complex operations on a plane in the 17th segment in the 32-part series. Learners first verify that multiplication by the reciprocal does the same geometrically as it does algebraically. The class then circles back...
EngageNY
Review of the Assumptions (part 1)
What was the property again? Tired of hearing this from your pupils? Use this table to organize properties studied and as a reference tool for individuals. Learners apply each property in the third column of the table to ensure their...
EngageNY
Linear Models
Expand your pupils' vocabulary! Learn how to use statistical vocabulary regarding linear models. The instructional activity teaches scholars the appropriate terminology for bivariate data analysis. To complete the module, individuals use...
EngageNY
The Distance from a Point to a Line
What is the fastest way to get from point A to line l? A straight perpendicular line! Learners use what they have learned in the previous lessons in this series and develop a formula for finding the shortest distance from a point to a...
EngageNY
Tangent Segments
What's so special about tangents? Learners first explore how if a circle is tangent to both rays of an angle, then its center is on the angle bisector. They then complete a set of exercises designed to explore further properties and...
Curated OER
Where Does Food Come From?
Distinguish between food and non-food items. Recognize that food is obtained from both plant and animal sources. Identify sources for some common animal foods then construct a simple food path from the farm to the consumer.
Virginia Department of Education
Properties of Real Numbers
Students use paper cups and colored chips to observe properties of operations with real numbers. As a class, students brainstorm and use manipulatives to demonstrate associative, commutative, distributive identity and inverse properties....
Curated OER
Statistics and Probablility
Statistics and Probability are all about collecting, organizing, and interpreting data. Young learners use previously collected data and construct a picture graph of the data on poster board. This stellar lesson should lead to...
Curated OER
Modeling pentagrams using Geometers Sketchpad
Students using visual modeling software will construct two regular pentagrams which are mathematically similar. They also create a multi-page document and learn to create links between the pages and to a website on the History of...
Curated OER
Birthdays and the Binary System
Students explore binary mathematics. In this middle school mathematics lesson, students investigate patterns and place value in the binary system. Students examine applications of binary mathematics by creating a birthday-guessing device.
Curated OER
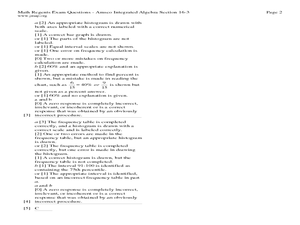
The Histogram
In this Algebra I/Algebra II worksheet, students construct and analyze histograms to develop a visual impression of the distributions of data. The two page worksheet contains five problems. Answer key is provided.
Curated OER
Anything I Can Do You Can Do Better
Students complete a two-week unit involving design and construction concepts. They watch a PowerPoint presentation about geometric shapes, draw the fourteen shapes incorporated in bridge construction, and in small groups design, build,...
Curated OER
Linear Computational Circuitry
In this electrical instructional activity, students draw a schematic design circuit board to grasp the understanding amplification in linear circuitry before answering a series of 35 open-ended questions pertaining to a variety of linear...


