Curated OER
Math: Reaching New Heights
Students apply math skills to assess the range, mean, mode, and median of data sets. Using a "Reaching New Heights" worksheet, they review and discuss how to calculate the answers. Students write complete explanations of all their...
Curated OER
Not Just an Average Class
Fourth graders work together to find the median, mode, and mean of their first and last names using a numerical code in this fun, interactive lesson. After a lecture/demo, 4th graders utilize a worksheet imbedded in this plan to gain...
Curated OER
Central Tendencies and Normal Distribution Curve
Fourth graders are given data (class test scores) to determine central tendencies, and find information needed to construct a normal distribution curve. They become proficient in calculating mode, median and average.
Illustrative Mathematics
Puzzle Times
Give your mathematicians this set of data and have them create a dot plot, then find mean and median. They are asked to question the values of the mean and median and decide why they are not equal. Have learners write their answers or...
Statistics Education Web
It’s Elemental! Sampling from the Periodic Table
How random is random? Demonstrate the different random sampling methods using a hands-on activity. Pupils use various sampling techniques to choose a random sample of elements from the periodic table. They use the different samples to...
Statistics Education Web
Using Dice to Introduce Sampling Distributions
Investigate the meaning of a sample proportion using this hands-on activity. Scholars collect data and realize that the larger the sample size the more closely the data resembles a normal distribution. They compare the sample proportion...
Michigan State University
In Search of Life
Explore the habitats around you with an activity that takes kids out of the classroom to learn about the local variety of habitats and the living things that call them home. In small groups, scholars investigate their surroundings,...
Curated OER
Averages
In this averages worksheet, 6th graders solve and complete 3 various types of problems. First, they find the mean, mode, median and range for each set of data shown. Then, students match each team to the picture shown that they think...
Curated OER
Statistics
For this statistics worksheet, 9th graders solve and complete 5 various types of problems related to determining statistics. First, they determine the data set where the median value is equal to the mean value. Then, students determine...
Curated OER
A Statistical Study by Adolescent Students on Relevant Issues
Students use statistics to study attributes of a local center for pregnant teenagers. They apply mean, median, mode and a correlation study between two variables.
Curated OER
Graphing Made Easy
Fourth graders discover the appropriate way to construct and analyze bar, line, picto, and circle graphs. They set up frequency tables and perform some statistical analysis (mean, median, and mode) on their data.
Curated OER
Integrating Math and Sports Project
Students work in pairs to choose a set data from one of the sports websites for their chosen sports. They find the mean, median, mode, and range of their data set. Students create a graph on Microsoft Excel and write several...
Curated OER
Misleading Statistics
In this misleading statistics worksheet, students identify misleading graphs. They determine the mean, median and mode of given data. Students determine the measure of central tendency which accurately describes the data. This one-page...
Curated OER
The Bell Curve
Students explore the concept of the bell curve. In this bell curve instructional activity, students discuss the controversy associated with the bell curve. Students use an applet to explore a normal distribution. Students discuss...
Curated OER
Finding Range
In this range worksheet, students enter mean, median and mode for sets of number, then enter the range.
Curated OER
Investigation - How Tall is the Average Sixth Grader?
Learners will measure each other and record the data in inches. They will use a stem and leaf plot to display data and figure out the average height of the students in a class. The other statistical data will be collected like the mode...
Curated OER
Mean, Mode, Range, Median
In this weather instructional activity, learners look at the average monthly temperatures and precipitation for their own city to determine the mean, mode, range, and median. This instructional activity has 8 fill in the blank questions.
Curated OER
Stem and Leaf Plots
In this measures of central tendency instructional activity, students study a stem and leaf plot pertaining to weekly low temperatures. Students use the plot to answer 6 questions. There will be a question that requires students to make...
Polar Trec
How Much Data is Enough?
The next time you read a magazine or watch the news, make note of how many graphs you see because they are everywhere! Here, scholars collect, enter, and graph data using computers. The graphs are then analyzed to aid in discussion of...
Illustrative Mathematics
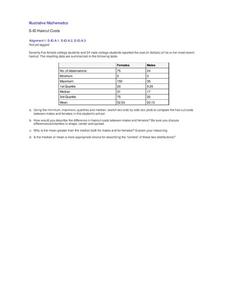
Haircut Costs
Who pays more for haircuts, men or women? Given quartile values, learners construct box and whiskers plots and interpret the results. They compare the mean and median, and discuss which is more appropriate under particular conditions....
Curated OER
Statistics
Seventh and eighth graders solve and complete three various types of problems. First, they find the median rate using the box-and-whisker plot shown. Then, learners describe the inter-quartile range. In addition, they determine whether...
Curated OER
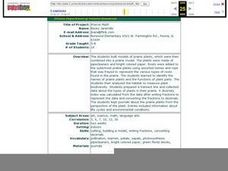
Prairie Math
Students work together to build models of prairie plants. Using the model, they estimate the height and then measure them using metric and standard units. They write a fraction to represent their part of the whole set and compare and...
Illustrative Mathematics
Accuracy of Carbon 14 Dating I
Here is an activity that is intended to highlight a very important issue about precision in reporting and understanding statements in a realistic scientific context. Discuss different ways of reporting the half life of Carbon 14 using...
Curated OER
Prairie Dogs: Finding the Balance
Students study about prairie dogs and determine the mean, median, and mode of a prairie dog tow's population.
Other popular searches
- Mean, Median, Mode
- Mean Median Mode
- Graphing Mean, Median, Mode
- Free Mean, Median, Mode
- Math; Mean, Median, Mode
- Mean Median Mode Range
- Mean, Median, Mode Range
- Mean Median and Mode
- Median and Mean Statistics
- Mean, Median, Mode, Range
- Mean, Median and Mode
- Mean Median Mode Lessons


