Curated OER
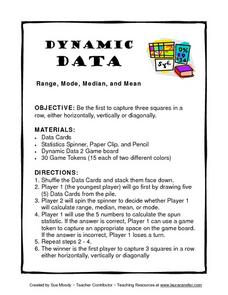
Dynamic Data Range, Mode, Median, and Mean
In this lesson, Dynamic Data Range, Mode, Median, and Mean, students play a game while figuring range, mode, median, and mean. Students spin for their task, figure the mode, mean, median or range of a row of numbers and gain a space on...
Scholastic
Study Jams! Mean/Average
Join Zoe as she calculates the average number of points RJ scored in his basketball games. This step-by-step presentation clearly models the procedure for finding the mean of a data set, including examples with both whole number and...
Scholastic
Study Jams! Median
Zoe is curious how many goals her soccer team usually scores in a game. To answer the question, she walks through the process of finding the median of a data set in this step-by-step presentation. Examples are included that model how to...
University of California
Student Workbook: Statistics and Probability
Statistically, practicing this packet completely helps young mathematicians do well on the test. The packet is adaptable to many grade levels as it includes basic probability and goes up to data analysis with mean, median, and...
Curated OER
The Three M's of Statistics: Mode, Median, Mean
Young mathematicians use the Visual Thesaurus to define mean, median, and mode. In this mean, median and mode instructional activity, learners use online sources to find the definitions of mean, median, and mode before applying the...
Curated OER
Mean, Median and Mode (II)
In this mean worksheet, students examine given information and determine the mean, mode and median of data. This one-page worksheet contains 10 problems. Answers are provided.
Curated OER
Starting With Stats
Statisticians analyze a data set of student IQs by finding measures of central tendency and dispersion such as mean, median, mode, and quartiles. They practice using a graphing calculator to find the values and analyze box plots and...
Curated OER
Averages: Mean, Median, Mode
After reviewing the process of finding the mean, median, mode, and average of a given data set, learners work through several practice problems. There are five problems related to mode, and five related to finding the mean. Great as...
Utah Education Network (UEN)
Statistics
Find the value in analyzing data values. Statistics is the focus in the fifth of seven installments of the 6th Grade Math series. Individuals learn to examine dot plots, histograms, and box plots by considering the shape, mean, median,...
Rice University
Introductory Statistics
Statistically speaking, the content covers several grades. Featuring all of the statistics typically covered in a college-level Statistics course, the expansive content spans from sixth grade on up to high school. Material...
Curated OER
Statistics - Central Tendency
In this statistics instructional activity, students solve and complete 13 different problems that include creating various box-and-whisker plots. First, they write a definition for mean, median, mode and range. Then students explain how...
Curated OER
Mean, Median and Mode (I)
In this online math worksheet, find the mean, median, and mode in a variety of sets of data. This excellent resource allows the students to check their answers, and to get "hints" should they run into difficulties. A terrific teaching tool!
Curated OER
Mode, Median, and Mean
Students define mode, median and mean, and perform mathematical operations to determine these 3 terms. In this statistics/math lesson, students practice memory strategies to help distinguish between mode, median, and mean. Students apply...
Mathematics Assessment Project
Mean, Median, Mode, and Range
What a find! Here is a lesson, designed to meet sixth grade math Common Core standards, that focuses on the calculation of different measures of center for the scores from a penalty shoot-out competition. An independent...
Curated OER
Statistics
In this statistics learning exercise, students solve and complete 6 different problems that include determining various types of statistics. First, they determine the data set where the median value is equal to the mean value. Then,...
Curated OER
Introduction to Statistics: Mean, Median, and Mode
Students explore the concepts of mean, median, and mode. They develop an understanding and familiarity with these concepts. Students explore mean and median in an efficient way. Students explore three different measures of center.
Curated OER
Integration: Statistics, Measures of Central Tendency
Learners find the mean, median, and mode for each of four data sets. They are given two line plots, and compute the median and mode of the shown data. They find the median and mode for three stem and leaf plots. They solve two word...
Curated OER
What's Your Average? What Do You Mean? I'm More Than Just Average
Upper grade and middle schoolers collect data, analyze and interpret the data. This three-part lesson should provide learners with a firm understanding about the differences between mean, median, and mode and how to perform the...
Curated OER
Statistics
Seventh and eighth graders solve and complete three various types of problems. First, they find the median rate using the box-and-whisker plot shown. Then, learners describe the inter-quartile range. In addition, they determine whether...
Curated OER
Mean, Median, Mode, and Range - Homework 14.3
In this data and statistics learning exercise, learners find the mean, median, mode, and range of 4 different sets of data. Next, students solve 1 word problem where they find the mean.
Curated OER
Data Analysis: Graphs, Charts, Tables, Statistics
In this data analysis worksheet, students interpret data in 5 problems involving graphs, tables, and scatterplots. Students construct 1 stem and leaf plot and find the mean, median, and mode of a data set.
Curated OER
Maps and Modes, Finding a Mean Home on the Range
Fifth graders investigate data from maps to solve problems. In this data lesson, 5th graders study maps and collect data from each map. Students present their data in a variety of ways and calculate the mode, mean, median, and range.
CK-12 Foundation
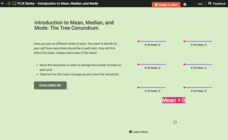
Introduction to Mean, Median, and Mode: The Tree Conundrum
How many trees should we plant? Using an interactive as a manipulative, individuals find the mean, median, and mode for sets of data. They determine the number of trees to plant in each plot of land to reach a statistical goal.
Curated OER
Statistics
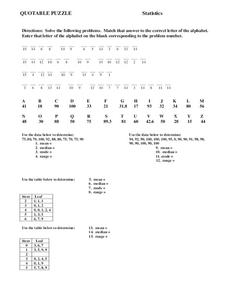
In this statistics worksheet, 8th graders solve and complete 15 different problems. First, they solve each problem by using the data given to determine the mean, median, mode, and range for each set. Then, students match that answer to...


