Curated OER
The Solution to Pollution is Dilution
Students consider what happens to herbicides or insecticides that are used in agricultural practices, especially herbicides that are used to control noxious weeds. They become acquaint with a chemical assessment method known as...
Curated OER
Zoo Poo
Students use Internet research to determine the amount of carbon dioxide produced per unit energy for biomass and coal. In this alternative energy instructional activity, students research to find out how much energy and carbon dioxide...
Curated OER
Polystyrene Containers
Students conduct experiments to determine the effectiveness of polystyrene containers at preventing heat loss. In this polymers lesson, students design an experiment to determine how effective Styrofoam burger containers are at...
Curated OER
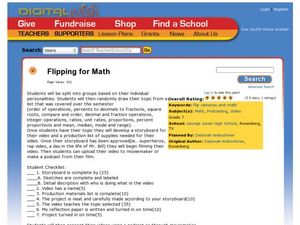
Flipping For Math
Seventh graders create a video of different formats to deliver a presentation of a math concept such as square roots, decimals, fractions, and more. In this math presentation lesson plan, 7th graders can plan a rap video, story,...
Curated OER
The Great Heat Escape
Students observe a demonstration on the role of thermal conductivity in heat transfer. In this thermal conductivity instructional activity, students design and conduct an experiment to compare the thermal conductivity of four...
Curated OER
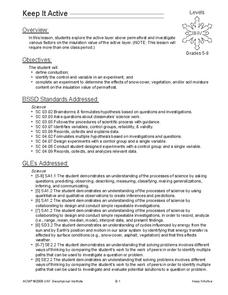
Keep it Active
Students explore the active layer above permafrost and investigate various factors on the insulation value of the active layer. In this energy transfer lesson, students conduct and experiment to determine the effects of snow cover,...
Curated OER
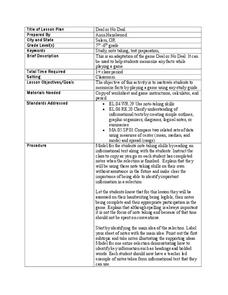
Deal or No Deal
Young scholars play a game in order to memorize any set of facts. In this memorization lesson, students play an adaptation of the game Deal or No Deal to help them review and memorize factual information. Young scholars also work on math...
Curated OER
Infusing Equity Gender into the Classroom
Students investigate if gender makes a difference in the classroom. In this statistics lesson, students collect data on whether equity by gender in the classroom makes students more successful.
Curated OER
The Spectrum of a Star
Tenth graders identify stars based on their line spectra. In this astronomy lesson, 10th graders analyze spectrograph and determine the elements present in the star. They explain the relationship between temperature and star classes.
Math Guy
Algebra 1 Practice Final
What makes this resource special? The amazing answer key that comes with worked out solutions and notes for each problem. Practice problems include all topics ranging from linear systems to simplifying exponential expressions. The packet...
Curated OER
Mathematics Module
Delve into graphing! The concepts covered begin with basic graphing basic coordinates and algebraic expressions on coordinate planes, and build up to graphing linear inequalities and equations. Learners solve and simplify various...
EngageNY
End-of-Module Assessment Task - Algebra 1 (Module 2)
Check for understanding at the end of your descriptive statistics unit with an end-of-module assessment. It uses five questions to measure progress toward mastery of descriptive statistics standards. Each question is developed to address...
Curated OER
Antonyms
Explore some higher-level antonyms with your high schoolers. There are 10 main words listed and five antonyms to select from for each. Example vocabulary words include demolish, ceremonious, and biased.
Houghton Mifflin Harcourt
Unit 3 Math Vocabulary Cards (Grade 3)
Looking for math vocabulary cards for third graders? Use a set of 15 math cards with terms associated with graphing. The top half of each sheet has the vocabulary word printed in bold text, and the bottom half includes the word's...
American Statistical Association
EllipSeeIt: Visualizing Strength and Direction of Correlation
Seeing is believing. Given several bivariate data sets, learners make scatter plots using the online SeeIt program to visualize the correlation. To get a more complete picture of the topic, they research their own data set and perform an...
Achieve
BMI Calculations
Obesity is a worldwide concern. Using survey results, learners compare local BMI statistics to celebrity BMI statistics. Scholars create box plots of the data, make observations about the shape and spread of the data, and examine the...
Curated OER
MAP Practice
In this geometry activity, students create circle, line and bar graphs using different comparisons of events. There are 24 questions with an answer key.
American Statistical Association
Tell it Like it is!
Scholars apply prior knowledge of statistics to write a conclusion. They summarize using correct academic language and tell the story of the data.
Statistics Education Web
Sampling in Archaeology
Compare different random sampling types using an archaeological setting. Scholars collect data from an archaeological plot using simple random samples, stratified random samples, systematic random samples, and cluster random samples....
Curated OER
US Airports, Assessment Variation
Determining relationships is all part of algebra and functions. Your mathematicians will decide the type of relationship between airports and population and translate what the slope and y-intercept represent. The problem is multiple...
EngageNY
Summarizing Bivariate Categorical Data
How do you summarize data that cannot be averaged? Using an exploratory method, learners complete a two-way frequency table on super powers. The subject matter builds upon 8th grade knowledge of two-way tables.
Statistics Education Web
Consuming Cola
Caffeine affects your heart rate — or does it? Learners study experimental design while conducting their own experiment. They collect heart rate data after drinking a caffeinated beverage, create a box plot, and draw conclusions. They...
Statistics Education Web
Saga of Survival (Using Data about Donner Party to Illustrate Descriptive Statistics)
What did gender have to do with the survival rates of the Donner Party? Using comparative box plots, classes compare the ages of the survivors and nonsurvivors. Using the same method, individuals make conclusions about the gender and...
College Board
Is That an Assumption or a Condition?
Don't assume your pupils understand assumptions. A teacher resource provides valuable information on inferences, assumptions, and conditions, and how scholars tend to overlook these aspects. It focuses on regression analysis, statistical...
Other popular searches
- Mean, Median, Mode
- Mean Median Mode
- Graphing Mean, Median, Mode
- Free Mean, Median, Mode
- Math; Mean, Median, Mode
- Mean Median Mode Range
- Mean, Median, Mode Range
- Mean Median and Mode
- Median and Mean Statistics
- Mean, Median, Mode, Range
- Mean, Median and Mode
- Mean Median Mode Lessons


