Curated OER
Probability: The Study of Chance
Students practice the basic principles of probability by conducting an experiment, determining if a game is fair, collecting data, interpreting data, displaying data, conducting analysis, and stating and applying the rule for probability.
Curated OER
Height and Weight Energy Intake
In this health worksheet, high schoolers examine the amount of calories needed for both sexes throughout life according to different heights and weights.
Curated OER
Sampling Rocks
Students examine how to take a sample by looking at rocks in the schoolyard. In this sampling lesson plan, students discuss ways to classify rocks by color, size, and weight. They think about how many rocks would make a good sample of...
Curated OER
Eight Integers and Eight Cubes
In this number puzzle worksheet, students are given 8 clues to find 8 integers. Clues refer to measures of central tendencies, abundant numbers, perfect cubes, and palindromes.
Curated OER
Bell Curve
Students explore averages by completing a data analysis activity. In this bell curve lesson, students measure different food items and plot their measurements on a X and Y axis. Students create bell curves around the average weight or...
Curated OER
Statistics: Reading and interpreting production graphs
Students interpret and create different types of graphs. They analyze data from charts, develop a survey and design appropriate graphic illustrations and make a presentation.
Curated OER
Searching The Word
Fifth graders review EOG math terms and definitions found in their math notebooks, and pick between 15 and 20 words to put in a word search.
Curated OER
Box Plots on the TI-83 Calculator
Eighth graders research box plots on the Internet. They gather real life statistics and analyze the collected statistics by making multiple box plots on the TI-83 calculator.
Curated OER
Bias in Statistics
Students work to develop surveys and collect data. They display the data using circle graphs, histograms, box and whisker plots, and scatter plots. Students use multimedia tools to develop a visual presentation to display their data.
Curated OER
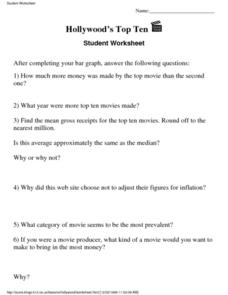
Hollywood’s Top Ten
For this entertainment worksheet, students answer 6 questions about their top ten favorite movies. The questions have no right answer because they are subjective.
Curated OER
Smarties Investigation
In this math worksheet, students complete a variety of activities using Smarties candy. For example, students estimate the number of each color, count the actual amount, and record their results in a tally chart.
Curated OER
The Statistics of M&Ms
Students explore the topic of statistics with M and Ms. In this math lesson plan, students use candy pieces to sort and gather information needed to create a bar graph. This lesson can be adapted to accommodate students in grades 1-12.
Curated OER
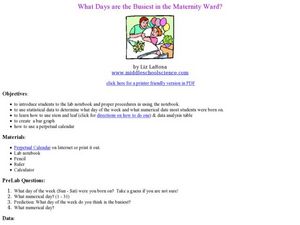
What Days Are the Busiest in the Maternity Ward?
Students form a conclusion using statistical data. In this statistical data lesson plan, students collect and analysis data to form a conclusion about what day of the week most babies are born.
Curated OER
Word Problems
In this word problems instructional activity, students read the word problems and use multiple operations to solve the problems. Students complete 5 word problems.
Curated OER
Math Vocabulary Antonyms and Synonyms Worksheet
In this math vocabulary worksheet, students write antonyms and synonyms for math vocabulary words. Students write antonyms and synonyms for 15 words.
Curated OER
Math Vocabulary Sentence Worksheet
In this math vocabulary worksheet, students put math vocabulary words into a sentence. Students put 15 math words into sentences.
Curated OER
Feeling Crabby?
Pupils analyze data to investigate the influence of water depth on size among deep-water crabs. They interpret results from this data, and apply the results regarding appropriate fishery regulations.
Curated OER
Flying High in Math
Seventh graders study how real airplanes fly and then they construct models of paper airplanes using design resources for the Internet and their own design. They use meaurement and caluculations in order to help them construct their...
Curated OER
Shooting Stats
Eighth graders discover the important role statistics play in sports and that appropriate data must be collected to do a statistical analysis. Students practice calculating statistics by charting a professional player of their choice.
Curated OER
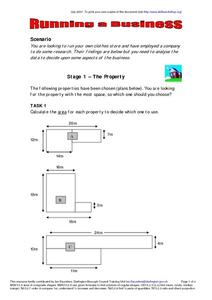
Running The Business
In this career worksheet, students are asked to look at the six stages necessary for the success of running a hypothetical new business.
Curated OER
How Psychologists Do Research
Students discover how psychologists complete their research on different topics. In groups, they describe the elements of an experiment and the importance of sampling during research. They identify ethical issues in their research and...
Curated OER
Using Statistics to Uncover More Evidence
Fifth graders participate in an online Web lesson plan on ways of interpreting data. They conduct a survey and interpret the results in a journal entry.
Curated OER
Closing the Case
Fifth graders collect data and prepare data displays using a survey with statistical information.
Curated OER
Home, Home in the City
Students create a spreadsheet that organizes housing information in the Houston area. They write a formula to determine the average price of homes in the Houston area.
Other popular searches
- Mean, Median, Mode
- Mean Median Mode
- Graphing Mean, Median, Mode
- Free Mean, Median, Mode
- Math; Mean, Median, Mode
- Mean Median Mode Range
- Mean, Median, Mode Range
- Mean Median and Mode
- Median and Mean Statistics
- Mean, Median, Mode, Range
- Mean, Median and Mode
- Mean Median Mode Lessons


