Alabama Learning Exchange
Alex: My Peanut Butter Is Better Than Yours!
The students will engage in the process of statistical data comparing data using tables and scatterplots. The students will compare data using measures of center (mean and median) and measures of spread (range). This instructional...
Alabama Learning Exchange
Alex: University and College Tuition Webquest
This is a technology-based and interdisciplinary project incorporating mathematics, language, and technology standards. Each student will research on the university's website: location, the mission statement, historical and interesting...
Khan Academy
Khan Academy: Normal Distributions Review
Normal distributions come up time and time again in statistics. A normal distribution has some interesting properties: it has a bell shape, the mean and median are equal, and 68% of the data falls within 1 standard deviation.
Mangahigh
Mangahigh: Data: Use the Range and Mode
This site provides students practice with the concept of range and mode. Students can learn about the topic by completing an interactive tutorial. Students can then take a ten question timed test to practice the skill.
Khan Academy
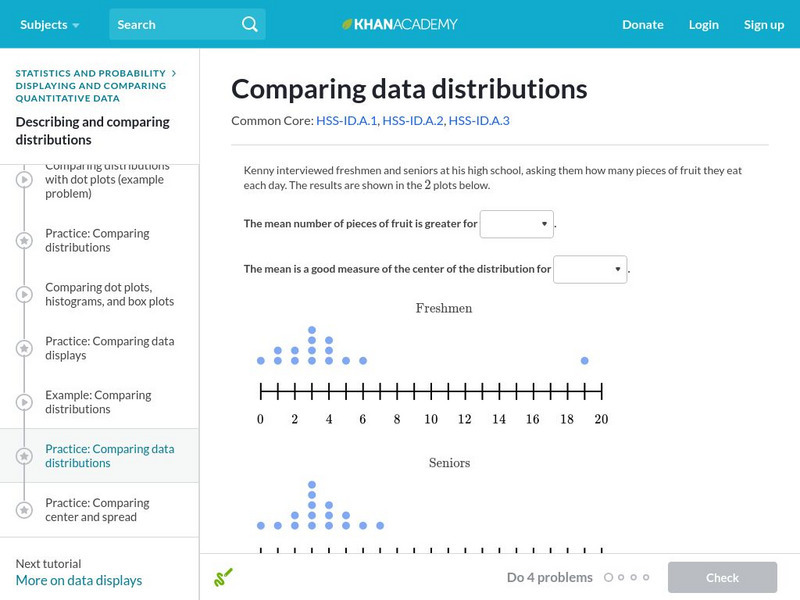
Khan Academy: Comparing Data Distributions
Take a look at two different data distributions and draw some comparisons. Students receive immediate feedback and have the opportunity to try questions repeatedly, watch a video or receive hints.
Illustrative Mathematics
Illustrative Mathematics: 6.sp Puppy Weights
A performance task asking students to create a graph of provided information and then answer two questions about the information provided with that graph.
University of Illinois
University of Illinois: Rollin' Rollin' Rollin'
This page from the University of Illinois is the beginning of a series that demonstrates the difference between the mean and median of a group of numbers. The sites use bar graphs to display the data.
Louisiana Department of Education
Louisiana Doe: Louisiana Believes: Eureka Math Parent Guide: Statistics
A guide to support parents as they work with their students with statistics.
PBS
Pbs Mathline: Bubble Mania [Pdf]
Bubble Mania is a lesson plan that focuses on the concept of measurement as it applies to the diameter, circumference, and area in a bubble. Extension activities and connections, related worksheets, and additional resources are included.
Other
Rhl School: Math Problem Solving
Utilize this site for lesson plans and worksheets to help your students with math problem-solving.
CK-12 Foundation
Ck 12: Measures of Central Tendency and Dispersion Grades 9 10
[Free Registration/Login may be required to access all resource tools.] Decide which measure of central tendency best describes a data set.
Other popular searches
- Mean, Median, Mode
- Mean Median Mode
- Graphing Mean, Median, Mode
- Free Mean, Median, Mode
- Math; Mean, Median, Mode
- Mean Median Mode Range
- Mean, Median, Mode Range
- Mean Median and Mode
- Median and Mean Statistics
- Mean, Median, Mode, Range
- Mean, Median and Mode
- Mean Median Mode Lessons


