Curated OER
Describing Data
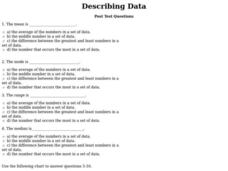
For this describing data worksheet, students answer multiple choice questions about mean, median, mode, and range. Students complete 10 questions total.
Curated OER
Making Data Meaningful
In this sample mean worksheet, students explore different ways "average" is used. Students use this information to find the sample mean of the height of a large class of students. Students find the mean, median, mode and range of two...
Curated OER
Family Size
In this family size activity, students complete a tally chart to determine data from a family size line plot. They organize the data in the chart to determine the mean, median, mode, and range of the data. There are six problems in...
Curated OER
Measures of Central Tendencies: Quartiles
In this statistics worksheet, students calculate the mean, median, mode, range, lower quartile, and upper quartile for 10 questions and interpret a box and whiskers graph.
Statistics Education Web
Did I Trap the Median?
One of the key questions in statistics is whether the results are good enough. Use an activity to help pupils understand the importance of sample size and the effect it has on variability. Groups collect their own sample data and compare...
Curated OER
Average, Mode, and Median
For this average, mode and median worksheet, students learn how to determine each of these values and practice finding all three. They are given a table of different falcon flight speeds and they calculate the average, mode and median...
Curated OER
Find the Range #5
In this mathematics worksheet, students view 6 different sets of numbers. Students, for each set of numbers, find the mean, mode, median and range. Students place their answers in the boxes provided.
Math Mammoth
Stem-and-Leaf Plots 3
In this stem-and-leaf instructional activity, students place statistical data in a stem-and-leaf plot. They identify the median, and range in a given set of data. There are four multi-step problems on this one-page instructional activity.
Curated OER
Mean, Median and Mode
Students define mean, median, mode and outliers. In this statistics lesson, students analyze data using the central tendencies. They follow a path through a maze collecting data. They analyze the data using the mean, median and mode.
Curated OER
Find the Range #1
In this mean, median, mode, and range learning exercise, students find the mean, median, mode, and range of a group of one digit numbers with numbers up to 9. Students complete 6 problems total.
Curated OER
Intro To Probability
Students investigate the concepts related to the practice of using probability. They review the use of mean, median, and mode within the context of previous instruction. Students predict outcomes and calculate them in small groups. The...
Curated OER
Data Analysis
In this data analysis worksheet, students answer 4 questions using a weather report chart. Topics include mean, median, mode and range.
Curated OER
Mean, Median, and Mode
Students calculate the mean, median, and mode in a set of numbers. In this data analysis lesson, students put a set of numbers in ascending order and perform calculations to find the mean, median, and mode.
Curated OER
Word Problems That Involve the Mean
In this online worksheet, students solve 5 word problems. Each problem requires students to calculate for x.
Curated OER
The Bell Curve
Learners are introduced to the concepts of the normal curve, skewness and the standard deviation. They discuss how the normal distribution has been used and misused to support conclusions.
Curated OER
Mean Absolute Deviation in Dot Plots
The lesson focuses on the ideas of dot plot representations and the mean absolute deviation of data sets.
Curated OER
Computing Mean, Mode and Median
Ninth graders collect data on basketball player's heights and determine the mean, median, and mode for the data.
Curated OER
Mean, Mode, Median, and Range
In this math worksheet, learners read about the mean, mode, median, and range. Students analyze a color-coded example problem for each.
Curated OER
Ranging the Triple M's
Fifth graders explore collecting and analyzing data. In this mean, median and mode lesson, 5th graders use real word data to determine the mean, median and mode. Students are given sets of numbers on index cards as asked to find the...
Curated OER
M&Ms; Line Plots and Graphing
Students, using small individual bags of M&Ms, engage in activities including; estimating, sorting, graphing, mean, median, mode, fractions, percentage, and averaging.
Utah Education Network (UEN)
Statistics
Find the value in analyzing data values. Statistics is the focus in the fifth of seven installments of the 6th Grade Math series. Individuals learn to examine dot plots, histograms, and box plots by considering the shape, mean, median,...
Radford University
Analyzing Data from Peer Survey
We all want to know what we're thinking. Scholars analyze and report data collected in a previous survey on peer attitudes toward current events. They calculate the mean, median, range, and standard deviation before creating histograms...
Curated OER
Mode, Median, and Mean
In this measures of central tendency worksheet, students determine the mode, median, and mean of a given data set based on children's test scores. They fill in a tally chart and answer 6 questions based on the data.
Curated OER
Statistics - Central Tendency
In this statistics activity, students solve and complete 13 different problems that include creating various box-and-whisker plots. First, they write a definition for mean, median, mode and range. Then students explain how to determine...
Other popular searches
- Mean, Median, Mode
- Mean Median Mode
- Graphing Mean, Median, Mode
- Free Mean, Median, Mode
- Math; Mean, Median, Mode
- Mean Median Mode Range
- Mean, Median, Mode Range
- Mean Median and Mode
- Median and Mean Statistics
- Mean, Median, Mode, Range
- Mean, Median and Mode
- Mean Median Mode Lessons


