NASA
Nasa Earth Observatory: Global Maps: Land Surface Temperature
View a global map from NASA's Earth Observatory that shows land surface temperature from February 2000 to November 2008. Learn how land surface temperature is measured and monitored.
PBS
Pbs Learning Media: Climate Change
This video segment adapted from NOVA explains the difference between weather and climate and features groundbreaking analysis revealing that Earth's climate has changed much faster than previously believed. [5:48]
Science Education Resource Center at Carleton College
Serc: Measuring and Comparing Temperatures
Using thermometers, learners will compare differences in the temperature of various materials and locations. They will record and chart the data that was collected and present the graphs to their classmates.
BBC
Bbc Skillswise: Measuring: Temperature
Information about reading and comparing temperature in Fahrenheit and Celsius.
The Franklin Institute
Franklin Institute Online: Make Your Own Rain Gauge
Make a simple rain gauge to measure the precipitation.
Scholastic
Scholastic: Study Jams! Science: Weather & Climate: Air Pressure and Wind
A video and a short multiple-choice quiz on the topic of air pressure and wind. It explains what makes air pressure change, how we measure it, how wind is created, and types of winds.
Other
Weather Questions: How Does Weather Radar Work?
Radar (which stands for RAdio Detection And Ranging) transmits microwaves in a focused beam. Some of this microwave energy bounces off of objects and returns to the radar to be measured. The radar sends pulses of energy, rather than a...
Weather Wiz Kids
Weather Wiz Kids: Wind
What is wind? How is it caused? This site offers simple answers to many common questions about wind as well as a chart of the Beaufort scale, which "is an empirical measure for the intensity of the weather based mainly on wind power."
Geography 4 kids
Geography4 kids.com: Measuring the Temperature
Take a look at how temperature is measured and what factors affect the air temperature.
Science Buddies
Science Buddies: Make a Hygrometer With Strands of Hair
Does your hair go crazy when the weather turns damp? Did you know that strands of hair can relax and lengthen when the humidity increases and then contract again when the humidity decreases? In fact, hair strands can be used as the basis...
Science Buddies
Science Buddies: How Atmospheric Temperature Affects the Water Content of Snow?
If you're lucky enough to live in a place that gets snow in winter, you know that the feel of the snow can vary a lot. Sometimes it can be light and fluffy, and other times heavy and wet. This project shows you how to use data from daily...
University Corporation for Atmospheric Research
Ucar: Introduction to Climate
A detailed overview of the Earth's climate, with explanations about the difference between weather and climate, dendrochronology, palynology, and how Earth's climate has changed over time. All information is reinforced through pictures,...
Science Struck
Science Struck: A Layman's Guide to How a Sling Psychrometer Works
A sling psychrometer is used to measure humidity levels. Read about its history, how it works, its design, and how to use it. Includes a relative humidity table.
Dan Satterfield
Dan's Wild Weather: Humidity
Explains how dew point is used to show the amount of moisture in the air. Gives an activity for measuring the dew point at home.
NOAA
Noaa: Photo Library: Solar Powered Surface Automated Measurement (Sam) Site
The National Oceanic and Atmospheric Administration provides a photo library of severe weather formations and the instruments that measure them. Here you can find a photograph of a solar-powered Surface Automated Measurement (SAM) site....
Dan Satterfield
Dan's Wild Wild Weather Page: Humidity
Use this site to find out how humidity works and perform some activities related to humidity.
NOAA
Noaa: National Weather Service: Hail
"Imagine a baseball dropped from an airplane flying at 30,000 feet; imagine that baseball reaching speeds of 120 MPH as it falls to the ground; and imagine you're under it!" How does hail form? How big can it get? Read more here about...
University of Illinois
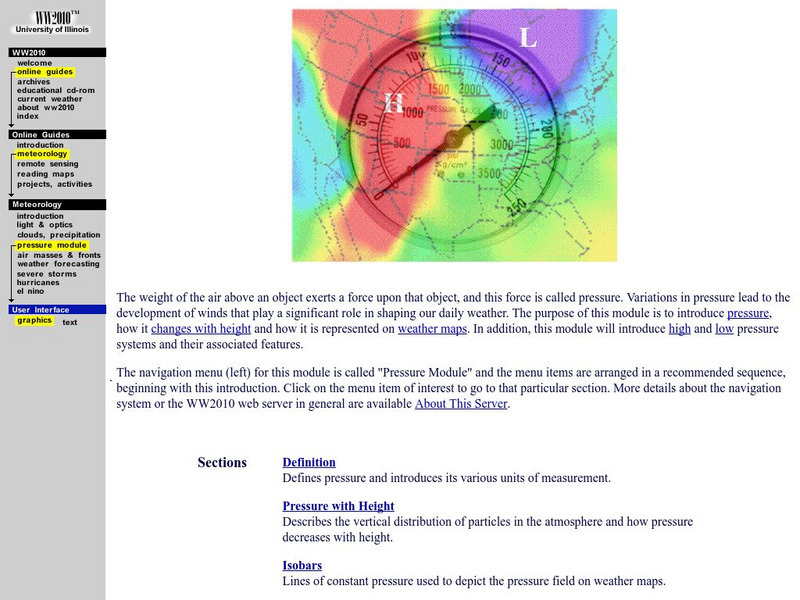
University of Illinois Extension: Ww2010: Atmospheric Pressure
This site from the University of Illinois describes what air pressure is and how it is measured. Explains high and low pressure areas, isobars, and how pressure changes with height.
TeachEngineering
Teach Engineering: Wild Wind
Students will learn the difference between global, prevailing and local winds. In this activity, students will make a wind vane out of paper, a straw and a soda bottle and use it to measure wind direction over time. Finally, they will...
NASA
Nasa: Trends of Snow Cover and Temperature in Alaska
This lesson plan allows learners to use NASA satellite data observations with surface measurements of snow in Alaska. Students will be able to make scientific predictions, find data correlations, and learn about data collection methods.
TeachEngineering
Teach Engineering: Engineering for the Earth
Young students are introduced to the complex systems of the Earth through numerous lessons on its natural resources, processes, weather, climate and landforms. Key earth science topics include rocks, soils and minerals, water and natural...
Science Education Resource Center at Carleton College
Serc: Climate Time Line Information Tool
A tool that summarizes climate history for time spans from 1 year to 100,000 years ago and beyond. It explores the relation between human development, weather, and climate. Students learn how past climate is measured, provides basic...
Science Buddies
Science Buddies: Make a Rain Gauge to Study Precipitation
In this hands-on weather lesson, 3rd graders design, build and use their own rain gauge to measure how much water falls during a rain storm.
TryEngineering
Try Engineering: Making Sense of Sensors
Lesson explore sensors focusing on ones that measure humidity. Students work in teams to design, build, test, and evaluate a hygrometer which was made out of everyday materials to measure humidity levels.
Other popular searches
- Tools Measuring Weather
- Tools for Measuring Weather
- Measuring Weather Activities
- Measuring Weather Changes
- Measuring Weather Conditions
- Measuring Weather Worksheets
- Weather, Measuring Tools


