Curated OER
Math: How Many Red M&Ms?
Sixth graders calculate the mean, median, and mode of candy M&Ms and find the percentage of each color. Once they complete the assignment, they compare their results with those of the candy company's percentages. As an extension,...
Curated OER
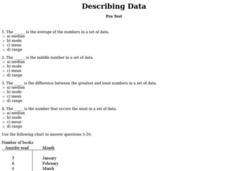
Describing Data
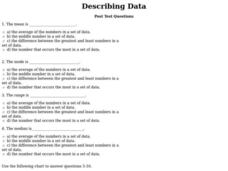
In this data activity, students complete multiple choice questions about mean, median, mode, and range. Students complete 10 questions total.
Curated OER
Technology vs. Nontechnology
Fourth graders determine the range, mean, median and mode using a computer spreadsheet. An identical set of calculations is done without using a computer. The results of each method are compared. They calculate the mode, median and range...
Curated OER
Data Analysis
In these data analysis worksheets, students complete 4 worksheets of activities for analyzing data. Students use the mean, median, mode, and range to organize the data.
Curated OER
Box and Whisker Plots
Seventh graders explore the concept of box and whisker plots. In this box and whisker plots lesson, 7th graders plot data on a box and whisker plot. Students discuss the mean, median, and mode of the data. Students discuss range,...
Curated OER
Averaging
Sixth graders explore the concept of mean, median, mode, and range. In this mean, median, mode, and range lesson, 6th graders work in groups to find the mean, median, mode, and range of their heights, distance from home to school, time...
Curated OER
Temperature Bar Graph
Students explore mean, median and mode. In this math lesson, students analyze temperature data and figure the mean, median, and mode of the data. Students graph the data in a bar graph.
Curated OER
Mean Averages
Fourth graders examine a number of data sets while practicing finding the mean, median, and mode of the numbers.
Curated OER
In the Right Mode
Sixth graders practice determining mean, median, mode, and range using individual mileage logs. They convert miles to kilometers and graph their results.
Curated OER
Special Segments in Triangles
In this special segments in triangles worksheet, 10th graders solve 6 various types of problems related to determining types of segments found in triangles. First, they find a segment if the line parallel is a median or an altitude....
Curated OER
Out to Lunch
Sixth graders create a menu. In this math activity, 6th graders use mean, median and mode to determine the prices for the typical cost of an appetizer, entree, kid's meal, drinks and dessert. Students write a number sentence to show how...
Curated OER
Makiing Sense of the Census
Students investigate trends in agriculture. In this secondary mathematics lesson, students evaluate agricultural census data from 1982 to 2202 as they compare the properties of the mean and the median. Students explore what sorts of...
Curated OER
Jumping Jaguars!
Second graders accurately measure the distances they and their classmates jump. They determine the mean, median and mode of specific jumps. They are required to have two measurements for each classmate, one for standing long jump and one...
Curated OER
Stem-and- Leaf Plots
Students are introduce to the notion of stem-and-leaf plots. They use stem-and-leaf plots to calculate the mean, median, and mode of a set of data. Students use computers to learn about stem-and-leaf plots.
Curated OER
Stem-and-Leaf Plots
Seventh graders study steam-and-leaf plots. Given specific data, they create a stem-and-leaf plot . Students identify the mean, mode, range and median. Afterward, they review vocabulary words.
Curated OER
Connecting Measurement
Students participate in activities the connect measurement to geometry, statistics, estimation, and the real world. They collect measurements from their elbow to the tip of their middle finger and make a box plot of the data as well as...
Curated OER
Statistics
High schoolers log their computer usage hours. They determine the mean, median, mode and standard deviation of the collected data. They make a frequency histogram of the grouped data, both on graph paper, and on the TI 83+ graphing...
Curated OER
Probability and Statistics
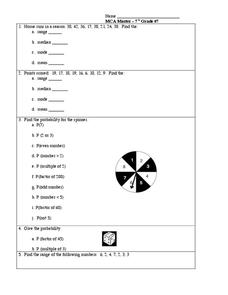
In this probability and statistics activity, students complete 5 problems regarding range, mean, median, mode, and a spinner probability problem.
Curated OER
Statistics
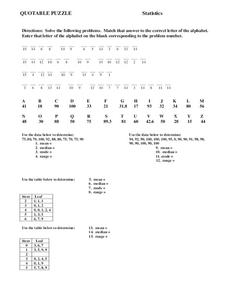
In this statistics worksheet, 8th graders solve and complete 15 different problems. First, they solve each problem by using the data given to determine the mean, median, mode, and range for each set. Then, students match that answer to...
Curated OER
Scatterplots
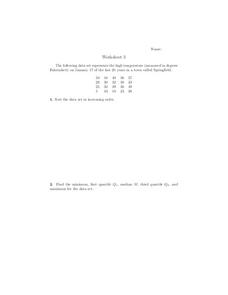
In this scatterplots learning exercise, 9th graders solve and complete 6 different word problems with different sets of data. First, they sort the data set in increasing order and find the minimum, first quartile, median, third quartile,...
Curated OER
Triangles
In this triangles worksheet, 10th graders solve and complete 6 different problems. First, they draw a median from a given point and an altitude. Then, students complete each statement using the picture. They also find the line that is...
Curated OER
Are Taxes "Normal?"
Students explore the concept of normal distribution. In this normal distribution lesson plan, students find the normal distribution of taxes in the 50 US states. Students make histograms, frequency tables, and find the mean and median of...
Curated OER
My Peanut Butter is Better Than Yours!
Students explore the concept of statistical data. In this statistical data lesson, students read an article about the dangers of peanut butter to those who are allergic. Students perform a taste test of two different brands of peanut...
Curated OER
Describing Data
For this describing data worksheet, students answer multiple choice questions about mean, median, mode, and range. Students complete 10 questions total.
Other popular searches
- Mean, Median, Mode
- Mean Median Mode
- Graphing Mean, Median, Mode
- Free Mean, Median, Mode
- Math; Mean, Median, Mode
- Mean Median Mode Range
- Mean, Median, Mode Range
- Mean Median and Mode
- Mathematics Mode and Median
- Median and Mean Statistics
- Mean, Median, Mode, Range
- Mean Median


