Curated OER
Median
Students solve problems involving triangles. In this geometry lesson, students use the properties of triangles to find the angles and side. They identify the median and altitude of the triangle.
Curated OER
Find the Range #1
In this mean, median, mode, and range learning exercise, students find the mean, median, mode, and range of a group of one digit numbers with numbers up to 9. Students complete 6 problems total.
Curated OER
U.S. Immigrant Statistics
Middle schoolers compare the populations of ten U.S. states to the number of immigrants who entered those states in a given year and calculate the mean, mode, and median of the grouping. They discuss why some states are more attractive...
Curated OER
Intro To Probability
Students investigate the concepts related to the practice of using probability. They review the use of mean, median, and mode within the context of previous instruction. Students predict outcomes and calculate them in small groups. The...
Curated OER
Word Problems
For this word problem worksheet, 6th graders solve 5 different word problems related to the data table shown. First, they determine the average of the overall scores as shown in the table and the mean of the overall scores. Then,...
Curated OER
Quiz: Percentiles and Quartiles
In this percentile and quartile worksheet, students complete a frequency table from given data. They determine the median, upper quartile, lower quartile and percentile ranks of specified conditions. This one-page worksheet contains...
Curated OER
Data Analysis
In this data analysis worksheet, students answer 4 questions using a weather report chart. Topics include mean, median, mode and range.
Curated OER
Making Data Meaningful
In this sample mean worksheet, students explore different ways "average" is used. Students use this information to find the sample mean of the height of a large class of students. Students find the mean, median, mode and range of two...
Curated OER
Seven Advanced Algebra Problem Sets
In this advanced algebra worksheet, students solve seven problem sets covering: linear equations, arithmetic sequence, slope, point-slope, median, linear system, substitution method and the elimination method.
Curated OER
Mean, Median, and Mode
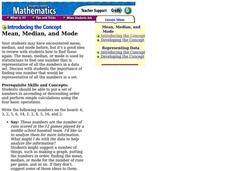
Students calculate the mean, median, and mode in a set of numbers. In this data analysis lesson, students put a set of numbers in ascending order and perform calculations to find the mean, median, and mode.
Curated OER
Leveled Problem Solving Mean, Median, and Mode
In this mean, mode, and median activity, students solve the word problems by finding the mean, median, and mode. Students solve six word problems.
Curated OER
Mode Mean Median
In this statistics worksheet, students practice finding number averages and statistics by finding the mode, median, and mean for the number sets.
EngageNY
Describing Center, Variability, and Shape of a Data Distribution from a Graphical Representation
What is the typical length of a yellow perch? Pupils analyze a histogram of lengths for a sample of yellow perch from the Great Lakes. They determine which measures of center and variability are best to use based upon the shape of the...
Curated OER
Statistics
In this statistics worksheet, students solve and complete 6 different problems that include determining various types of statistics. First, they determine the data set where the median value is equal to the mean value. Then, students use...
Curated OER
Box-and-Whisker Plots
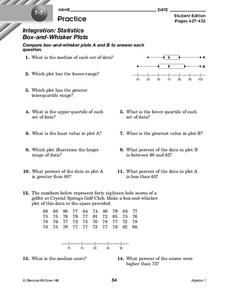
In this box-and-whisker plots worksheet, 9th graders solve and complete 14 different problems that include comparing various box-and-whisker plots. First, they determine the median for each set of data and plot the lesser range. Then,...
Curated OER
Statistics
In this statistics worksheet, 9th graders solve and complete 10 various types of problems that include using different types of graphs to illustrate data. First, they determine the median score for each stem-and-leaf plot. Then, students...
Curated OER
Mean and Median
Pupils identify the different central tendencies. In this probability lesson, students create the correct type of graphs to analyze their data. They make predictions and draw conclusions from their data.
Curated OER
Play It
There are a number of activities here that look at representing data in different ways. One activity, has young data analysts conduct a class survey regarding a new radio station, summarize a data set, and use central tendencies to...
Curated OER
Scatterplot
In this scatterplot learning exercise, 9th graders solve and complete 7 different problems that include defining various scatterplots. First, they use the data plotted on the scatterplot that represent the best prediction. Then, students...
Curated OER
Tricky Averages and Challenging Word Problems
In these two challenging problem solving worksheets, students calculate the mean, median, and mode and apply the results to find which average is best and then solve challenging multiple answers story problems. Students solve 16 problems.
CK-12 Foundation
Understand and Create Histograms: Histograms
Determine the shape of weight. Using the interactive, class members build a histogram displaying weight ranges collected in a P.E. class. Scholars describe the shape of the histogram and determine which measure of central tendency to use...
CK-12 Foundation
Mode: Boxes of Oranges
See how your data stacks up. Pupils stack crates of oranges in increasing order, creating a simple bar graph. Using the graph, individuals determine measures of center and describe the shape of the distribution. Scholars determine what...
Curated OER
Global Statistics
Students determine statistics based on data. In this statistics lesson, students use data and record in charts. Students create graphs based on the statistics found.
Curated OER
Project Interactive--Stem and Leaf Plotter
In this excellent stem and leaf plotter learning exercise, learners construct, arrange and write a report of how to interpret the leaves they collect in this data analysis. Students answer 4 detailed questions regarding the data analysis...
Other popular searches
- Mean, Median, Mode
- Mean Median Mode
- Graphing Mean, Median, Mode
- Free Mean, Median, Mode
- Math; Mean, Median, Mode
- Mean Median Mode Range
- Mean, Median, Mode Range
- Mean Median and Mode
- Mathematics Mode and Median
- Median and Mean Statistics
- Mean, Median, Mode, Range
- Mean Median


