Curated OER
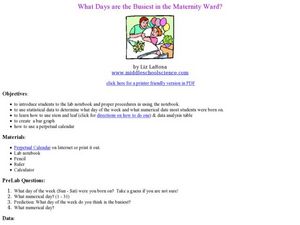
What Days Are the Busiest in the Maternity Ward?
Young scholars form a conclusion using statistical data. In this statistical data lesson, students collect and analysis data to form a conclusion about what day of the week most babies are born.
Curated OER
Design Team Challenge
Students work in groups to build a robot. In this robotics lesson, students create an electronic robot and program it to follow directions. They create an obstacle course for the robot to follow and test its performance.
Alabama Learning Exchange
The State Capital of Stem and Leaf
Students explore the concept of stem and leaf plots. In this stem and leaf plots lesson, students plot the 50 US states' capitals on a stem and leaf plot according to the first letter of each state. Students compare...
Curated OER
What I Didn't Know...
Students practice creating wikis. In this wiki lesson, students create a wiki about any math topic that they know nothing about. Students learn about their topic and create a wiki that explains the math topic in detail.
Curated OER
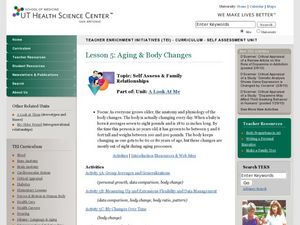
Aging & Body Changes
Students complete several activities that have to do with aging. In this body changes lesson students take group averages, measure flexibility and see their changes over time.
Curated OER
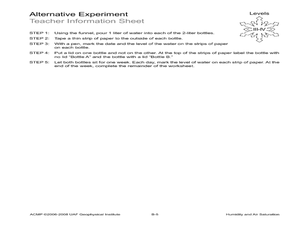
Humidity and Air Saturation
Learners experiment with air saturation. For this earth science lesson, students first complete an activity which teaches humidity. Then they use the scientific method to create their own experiments to test how long it takes a...
Curated OER
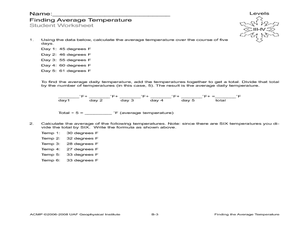
Finding the Average Temperature
Young scholars calculate averages. In this average temperature instructional activity, students collect data and use their problem solving skills to calculate average temperatures.
Curated OER
Halloween Graphitti
Students complete multi-curricular activities in a Halloween themed lesson. In this Halloween lesson, students examine newspaper ads to find prices of pumpkins and use them to complete a stem and leaf plot. Students find the diameter,...
Curated OER
Macbeth Madness
Young scholars research Macbeth online and complete computer and graphing activities for the play. In this Macbeth activities lesson, students research Macbeth and bookmark the URL's. Young scholars complete activities for the topic on...
Curated OER
Personal Interviews
Young scholars interview a person in a career field they are interested in. In this career interview lesson, students identify a career they are interested in and the requirements of the job. Young scholars research the career and...
Curated OER
Be the Kiwi: Gender Roles
Learners take a look at gender roles in New Zealand. In this global issues instructional activity, students analyze statistics that reveal the divide between men and women employees in the country.
Curated OER
Constructing Parallel and Perpendicular Lines
In this geometry worksheet, students construct lines that are parallel and perpendicular forming different angles. They differentiate between interior and exterior angles. Students identify the angles formed by a transversal and...
Curated OER
Building Literacy Through Character
Second graders connect reading to writing by making predictions, completing text to world connections, solving problems, and more. In this reading and writing lesson plan, 2nd graders draw conclusions after reading and write them down.
Curated OER
Analyzing Country Data
Students analyze different data in percentage form. In this statistics instructional activity, students plot data using box-plots, dotplot, and histogram. They compare and contrast the collected data using the boxplot.
Curated OER
Who Does the Lottery Benefit?
Students investigate the pros and cons of the lottery. In this algebra lesson, students use the formulas for permutation and combination to test their arguments about the lottery. They collect data about their argument and plot it on a...
Curated OER
Studying Special Segments in Triangles
Students investigate special segments in triangles. For this geometry lesson, students graph, compare, estimate and predict findings based on their data. They differentiate between similarity and congruence of triangles.
Curated OER
How Sharp Is Your Memory?
Young scholars play a memory game as they explore reasoning. In this algebra lesson, students identify concepts using pictures and words. They model real life scenarios using hands on manipulatives.
Curated OER
Bell Curve
Students explore averages by completing a data analysis activity. In this bell curve lesson, students measure different food items and plot their measurements on a X and Y axis. Students create bell curves around the average weight or...
Curated OER
Misleading Graphs
Students explore number relationships by participating in a data collection activity. In this statistics lesson, students participate in a role-play activitiy in which they own a scrap material storefront that must replenish its...
Curated OER
Feeling Crabby?
Young scholars analyze data to investigate the influence of water depth on size among deep-water crabs. They interpret results from this data, and apply the results regarding appropriate fishery regulations.
Curated OER
Listen to Your Heart
Sixth graders explore how exercise affects heart rate and use spreadsheets to record and analyze data.
Curated OER
Effective Photojournalism
Students determine what makes a quality photo and take and edit appropriate photos that relate to their assigned articles. They select good pictures for their publication.
Curated OER
The Guise of a Graph Gumshoe
Eighth graders practice constructing bar, circle, and box-and-whisker graphs. They practice reading and interpreting data displays and explore how different displays of data can lead to different interpretations.
Curated OER
Using Computer for Statistical Analysis
Young scholars examine the use for spreadsheets in analyzing data. They make spreadsheets that display and calculate a given data set such as temperature change.
Other popular searches
- Mean, Median, Mode
- Mean Median Mode
- Graphing Mean, Median, Mode
- Free Mean, Median, Mode
- Math; Mean, Median, Mode
- Mean Median Mode Range
- Mean, Median, Mode Range
- Mean Median and Mode
- Mathematics Mode and Median
- Median and Mean Statistics
- Mean, Median, Mode, Range
- Mean Median


