Curated OER
Exploring Height with Abe Lincoln
Learners examine a life-size count out of Abraham Lincoln to get a visual comparison of their height and Lincoln's. They work in pairs and trace each other's body and measure from head to toe in inches using a ruler. They then subtract...
Curated OER
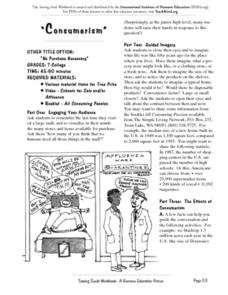
Consumerism: No Purchase Necessary
Learners read a script that helps them understand the ins and outs of consumerism. They watch a video (not included), and engage in two additional activities. The lesson engages critical thinking skills and brings awareness to the...
Curated OER
Informal Geometry
Middle and high schoolers solve and complete 29 various types of problems. First, they match each name with its correct formula. Then, students find the length of the missing side and the distance between the two points given. In...
Curated OER
MAP Practice
In this geometry worksheet, students create circle, line and bar graphs using different comparisons of events. There are 24 questions with an answer key.
Curated OER
Questioning NASA
Space science and math collide in this inquiry that investigates launching times for antacid-tablet rockets! Upper elementary or middle school learners collect data as they launch these mini rockets. They apply concepts of place value...
Curated OER
Statistics Canada
Students practice using graphing tools to make tables, bar charts, scatter graphs, and histograms, using census data. They apply the concept of measures of central tendency, examine the effects of outliers. They also write inferences and...
Curated OER
Geometry/Math A Regents Questions: Angle Bisectors
In this angle bisector worksheet, students solve five short answer and multiple choice problems. Students construct angle bisectors using a compass.
Curated OER
Point Comparisons
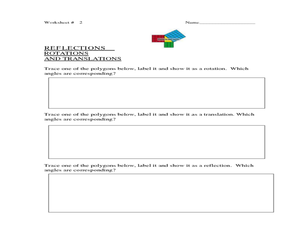
Young geometers investigate two-dimensional figures using coordinate grids. They identify polygons and draw examples of their reflection, rotation, and translation on a coordinate grid. And they complete a worksheet practicing examples...
Curated OER
Worksheet 3: Earth's Climate System II
A diagram of a mountain range and the prevailing winds is shown at the top of the page. Meteorology pupils describe the weather conditions at different points on the diagram. They explain the El Nino effect and why evaporation and...
Curated OER
What Can Data Tell Us?
Students explore data distribution. For this data analysis lesson, students create a data distribution table by playing the game "Tower of Hanoi" from the Hall of Science. Students analyze their data and answer data driven questions.
Curated OER
Antonyms
Explore some higher-level antonyms with your high schoolers. There are 10 main words listed and five antonyms to select from for each. Example vocabulary words include demolish, ceremonious, and biased.
American Statistical Association
Tell it Like it is!
Scholars apply prior knowledge of statistics to write a conclusion. They summarize using correct academic language and tell the story of the data.
American Statistical Association
An A-MAZE-ING Comparison
Teach your class how to use descriptive statistics through a hands-on data collection activity. Pupils collect their own data, calculate test statistics, and interpret the results in context. They compare male and female results, looking...
American Statistical Association
Colors Challenge!
Does writing the name of a color in a different colored ink affect one's ability to read it? Scholars design an experiment to answer this question. They collect the data, analyze the statistics, and draw a conclusion based on...
Statistics Education Web
Sampling in Archaeology
Compare different random sampling types using an archaeological setting. Scholars collect data from an archaeological plot using simple random samples, stratified random samples, systematic random samples, and cluster random samples....
Statistics Education Web
How High Can You Jump?
How high can your pupils jump? Learners design an experiment to answer this question. After collecting the data, they create box plots and scatter plots to analyze the data. To finish the lesson, they use the data to draw conclusions.
Statistics Education Web
Using Dice to Introduce Sampling Distributions
Investigate the meaning of a sample proportion using this hands-on activity. Scholars collect data and realize that the larger the sample size the more closely the data resembles a normal distribution. They compare the sample proportion...
Statistics Education Web
It Creeps. It Crawls. Watch Out For The Blob!
How do you find the area of an irregular shape? Class members calculate the area of an irregular shape by finding the area of a random sampling of the shape. Individuals then utilize a confidence interval to improve accuracy and use a...
Bytes Arithmetic
Geometry Pad+
Graphing paper, pencil, ruler, protractor, and compass, all get replaced or supplemented with this dynamic geometry application. Here, you can create, move, and scale many different shapes, as well as, explore and change their properties...
Curated OER
US Airports, Assessment Variation
Determining relationships is all part of algebra and functions. Your mathematicians will decide the type of relationship between airports and population and translate what the slope and y-intercept represent. The problem is multiple...
Curated OER
Describing Data
Your learners will practice many ways of describing data using coordinate algebra in this unit written to address many Common Core State Standards. Simple examples of different ways to organize data are shared and then practice problems...
Shodor Education Foundation
InteGreat
Hands-on investigation of Riemann sums becomes possible without intensive arithmetic gymnastics with this interactive lesson plan. Learners manipulate online graphing tools to develop and test theories about right, left, and...
EngageNY
Summarizing Bivariate Categorical Data
How do you summarize data that cannot be averaged? Using an exploratory method, learners complete a two-way frequency table on super powers. The subject matter builds upon 8th grade knowledge of two-way tables.
Achieve
BMI Calculations
Obesity is a worldwide concern. Using survey results, learners compare local BMI statistics to celebrity BMI statistics. Scholars create box plots of the data, make observations about the shape and spread of the data, and examine the...
Other popular searches
- Mean, Median, Mode
- Mean Median Mode
- Graphing Mean, Median, Mode
- Free Mean, Median, Mode
- Math; Mean, Median, Mode
- Mean Median Mode Range
- Mean, Median, Mode Range
- Mean Median and Mode
- Mathematics Mode and Median
- Median and Mean Statistics
- Mean, Median, Mode, Range
- Mean Median


