Curated OER
Probability: The Study of Chance
Students conduct an experiment, determine if a game is fair, and collect data. They interpret data, then display line graph. They conduct analysis of game for probability.
Curated OER
Box and Whiskers
Middle schoolers discover how to relate collected data with a box and whiskers graph in a number of formats. They collect, organize, create, and interpret a box and whiskers graph. Pupils interpret the difference between sets of data,...
Curated OER
Fun with Math using Magnetic Force
Sixth graders explore and discuss the effectiveness of magnets in different situations. In this math lesson, 6th graders discuss rate and graphs after exploring with magnets using different restrictions on the magnets. They analyze their...
Curated OER
What Can Data Tell Us?
Students analyze data they have collected themselves and by their classmates. In groups, they create data distributions to identify the highest, lowest and middle values. As a class, they discuss the concept of sample size and how it can...
Curated OER
Height versus Shoe Size
Students find a correlation between a person's height and his/her shoe size. They have access to entering data into lists on a graphing calculator and can complete scatter plots. Students read and interpret a scatter plot and use the...
Curated OER
What's Up With My Class
Learners collect data about their class and they use Excel spreadsheet to display their tables and graphs about the class. They answer survey questions and collect their data. Students create a graph of their choice to display the...
Curated OER
Graphs: All About Our Class
Students respond to survey questions, discuss results, brainstorm ways to represent survey information, and create table of class results. They find mean, range, and percentages, and create graph to display results.
Curated OER
Clam Challenge
In this clams worksheet, students explore clam characteristics. Students complete nine multiple choice questions about clam facts.
Curated OER
Clam Vocabulary
In this clam vocabulary skills worksheet, students match the 9 clam-related terms in the word bank to the appropriate definitions.
Curated OER
Clam Crossword
In this clams crossword puzzle worksheet, students use the 10 clues and the terms in the word bank to help them correctly complete the word puzzle.
Curated OER
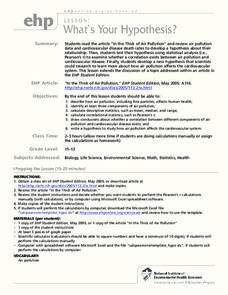
What's Your Hypothesis?
Find the article, "In the Thick of Air Pollution," not through the resource link in the lesson plan, but through an Internet search. Have high schoolers read it and perform calculations with the statistics provided. The objective is to...
Curated OER
Interpreting and Displaying Sets of Data
Students explore the concept of interpreting data. In this interpreting data lesson, students make a line plot of themselves according to the number of cubes they can hold in their hand. Students create their own data to graph and...
Alabama Learning Exchange
I Know What You Did Last Summer: A Data Graphing Project
Young scholars participate in graphing data. In this graphing data lesson, students make a stem and leaf plot of their summer activities. Young scholars create numerous graphs on poster boards. Students discuss the differences between...
Curated OER
Mean Absolute Deviation in Dot Plots
The lesson focuses on the ideas of dot plot representations and the mean absolute deviation of data sets.
Curated OER
Beary O'Mometer Learns About Careers In Meteorology
Young scholars explore the field of meteorology. In this meteorology lesson, students explore weather-related careers as they research the field of study as well as various weather concepts. Young scholars interview meteorologists, write...
Curated OER
Make a Frequency Table and a Histogram for a Given Set of Data
In this data recording and data organization worksheet, students create one frequency table and one histogram for a given list of data. Explanations and examples for frequency tables and histograms are given.
Curated OER
The Way to Better Grades!
Pupils collect and analyze data. In this statistics lesson, learners create a scatter plot from their collected data. They use, tables and graphs to analyze the data and mae decisions.
Curated OER
Small and Large Squares
Young mathematicians classify squares according to attributes. They sort squares according to specific attributes. Students explore squares in repeating patterns and order squares according to size. Engaging extension activities are...
Curated OER
Mean and Standard Deviation
Get two activities with one lesson. The first lesson, is appropriate for grades 6-12 and takes about 20 minutes. It introduces the concept of measures of central tendency, primarily the mean, and discusses its uses as well as its...
Curated OER
Grammar Worksheets: Who or Whom?
Who or whom? Do your young grammarians need extra practice using interrogative pronouns correctly? The seven sentences in this exercise will provide that opportunity; however, the activity does not provide definitions, examples, or an...
Georgia Department of Education
The Basketball Star
Have learners use math to prove they are sports stars! Assess a pupil's ability to create and analyze data using a variety of graphs. The class will be motivated by the association of math and basketball data.
Teach-nology
Using the Thesaurus: Synonyms
Kids are asked to choose the one option that is not a synonym for the provided keyword on a synonym worksheet.
Curated OER
Measures of Central Tendency
For this Algebra I worksheet, 9th graders determine the measures of central tendency for a given data set. The one page worksheet contains four problems. Answers are provided.
Curated OER
Exploring Data Sets and Statistics in Baseball
Young scholars explore the concept data sets. In this data sets lesson, students find the 5 number summaries for salaries of teachers and compare them with 5 number summaries of professional baseball players. Young scholars use box and...
Other popular searches
- Mean, Median, Mode
- Mean Median Mode
- Graphing Mean, Median, Mode
- Free Mean, Median, Mode
- Math; Mean, Median, Mode
- Mean Median Mode Range
- Mean, Median, Mode Range
- Mean Median and Mode
- Mathematics Mode and Median
- Median and Mean Statistics
- Mean, Median, Mode, Range
- Mean Median


