Curated OER
Identifying Different Types of Graphs
This is an outstanding presentation on graphs and statistics. Learners choose which type of graph is being shown, and also gain practice in the techniques used to find the mean, median, and mode of sets of numbers. Very good!
Curated OER
Drops on a Penny
Young scientists explore the concept of surface tension at is applies to water. For this activity, learners use a dropper to place drops of water on a penny. Each group guesses how many drops a heads-up penny will hold, then conducts the...
Curated OER
Starting With Stats
Statisticians analyze a data set of student IQs by finding measures of central tendency and dispersion such as mean, median, mode, and quartiles. They practice using a graphing calculator to find the values and analyze box plots and...
Curated OER
Measures of Central Tendency Using Scientific Calculators
Learners explore mean, median, and mode as they model mathematics in real-world problem situations. The lesson requires the use of the TI 30X IIS.
Curated OER
Super Ticket Sales
Use this graphing data using box and whisker plots lesson to have learners make box and whisker plots about ticket sales of popular movies. They find the mean, median, and mode of the data. Pupils compare ticket sales of the opening...
Curated OER
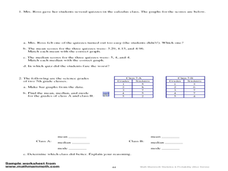
Measures of Central Tendency
Here is a measures of central tendency worksheet in which learners solve five multiple choice problems. They find the mean, median, and mode of a data set.
Curated OER
Math - Blank Jeopardy
Double Jeopardy! Review polynomials, statistics, triangles, graphing, mode, median, mean, measurement, slope, distance, and ratio. Note: Have everyone use a white board to do the problems to get a quick check on understanding.
Curated OER
Averages
Your class can view this resource to discover the wonders of averages. The mean, median, mode, and range are all defined, exemplified, and demonstrated. Practice problems to be completed as a class make this a really handy presentation.
Curated OER
Investigating Median, Mode, and Mean
Students develop strategies to organize data while following teacher demonstration. They calculate the mean, median and mode of a data set while determining the relationships between the numbers. They analyze data from tables and double...
Curated OER
Altitude, Median, and Angle Bisector of a Triangle
Learners investigate the special properties of an altitude, a median, and an angle bisector and explore how these special segments divide the area of a triangle. The dynamic nature of Cabri Jr. allows pupils to form and verify conjectures.
Curated OER
Medians and Altitudes of Triangles
In this geometry worksheet, 10th graders determine if a given segment is a median or altitude of a triangle and use then find the indicated missing length or equation of a line. The two page worksheet contains twenty...
EngageNY
Special Lines in Triangles (part 2)
Medians, midsegments, altitudes, oh my! Pupils study the properties of the median of a triangle, initially examining a proof utilizing midsegments to determine the length ratio of a median. They then use the information to find missing...
Noyce Foundation
Ducklings
The class gets their mean and median all in a row with an assessment task that uses a population of ducklings to work with data displays and measures of central tendency. Pupils create a frequency chart and calculate the mean and median....
Shodor Education Foundation
Skew Distribution
Slide the class into a skewed view. Learners alter the location of the median relative to the mean of a normal curve to create a skew distribution. They compare the curve to a histogram distribution with the same skewness.
Shodor Education Foundation
Box Plot
What information can come from a box? Learners choose a data set to display as a box plot and decide whether to include the median in the calculation of the quartiles, show the outliers, and change the scale. To finish the lesson,...
Shodor Education Foundation
Plop It!
Build upon and stack up data to get the complete picture. Using the applet, pupils build bar graphs. As the bar graph builds, the interactive graphically displays the mean, median, and mode. Learners finish by exploring the changes in...
Curated OER
Means, Medians, and Modes
In this math worksheet, students find the mean, median, and mode for each set of numbers. Then they apply the methods to the word problems.
Curated OER
Dynamic Data Range, Mode, and Median
Students practice statistics skills by calculating range, mode, and median. In this 4th - 6th grade lesson plan, students calculate range, median, and mode of given numbers while playing a game.
Curated OER
Mean, Median and Range
In this measures of central tendency worksheet, students solve 6 problems. Students analyze the set of given numbers and calculate the median, mean and range for each.
Curated OER
Mean, Median, Mode and Range
In this math worksheet, students learn to find the mean, median, mode and range of a set of data. Students read the information and answer 5 questions in which they calculate mean, median, mode and range.
Curated OER
Mode, Median, and Mean
Students define mode, median and mean, and perform mathematical operations to determine these 3 terms. In this statistics/math lesson, students practice memory strategies to help distinguish between mode, median, and mean. Students apply...
Curated OER
Using mean, median, and mode
In this mean, median, and mode activity, learners read how to use each method and then complete problems using each one. Students complete 8 problems.
Curated OER
TAKS Math Quiz-Median
In this TAKS math quiz worksheet, students take an online quiz focused on finding median. Quiz may be graded online by clicking a link.
Curated OER
Using Mean, Median, Mode, and Range through Basketball
Eighth graders use the sports pages of the newspaper to analyze the mean, median, mode and range of basketball statistics.
Other popular searches
- Mean, Median, Mode
- Mean Median Mode
- Graphing Mean, Median, Mode
- Free Mean, Median, Mode
- Math; Mean, Median, Mode
- Mean Median Mode Range
- Mean, Median, Mode Range
- Mean Median and Mode
- Mathematics Mode and Median
- Median and Mean Statistics
- Mean, Median, Mode, Range
- Mean Median


