Math Mammoth
Stem-and-Leaf Plots 3
In this stem-and-leaf instructional activity, students place statistical data in a stem-and-leaf plot. They identify the median, and range in a given set of data. There are four multi-step problems on this one-page instructional activity.
Curated OER
Atlatl Lessons Grades 4-12: Lesson for Beginning Users of Atlatl
Sixth graders determine the mean, range median and mode of a set of numbers and display them. In this data activity students form a set of data and use computer spreadsheet to display the information. They extend of the process by...
Curated OER
Find the Range #2
In this finding the range worksheet, students find the mean, median, mode, and range of each of six number sets. They write the answers in the boxes next to each label.
Curated OER
Find the Range #5
In this mathematics worksheet, students view 6 different sets of numbers. Students, for each set of numbers, find the mean, mode, median and range. Students place their answers in the boxes provided.
Curated OER
Geometric Concepts and Polygons
In this geometry worksheet, students identify the altitude, perpendicular bisector, median, angle bisector and the area of different polygons. There are 33 problems.
Curated OER
Batter Up! Math Stations
Math stations that review important concepts with the real-world example of baseball.
Curated OER
Lesson 5.3 Vocabulary Quiz: Concurrent Lines, Medians, & Altitudes
For this vocabulary worksheet, students match a given vocabulary word to the correct definition. Words include such terms as altitude, centroid, circumcenter, circumscribed circle, inscribed circle, median and orthocenter. This...
Curated OER
Averages: Computing Mean, Mode and Median
Seventh graders use daily temperature models to find the mean, mode and median.
Curated OER
Mean, Median, Mode, and Range: Practice
In this line plots worksheet, students make a line plot for each set of data and identify any clusters or gaps. Students then find the mean, median, mode, and range for the first four problems. Students then find n using the given mean,...
Curated OER
Computing Mean, Mode and Median
Ninth graders collect data on basketball player's heights and determine the mean, median, and mode for the data.
Curated OER
Mean, Median, and Mode
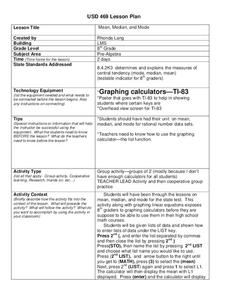
Eighth graders practice using the LIST key on graphing calculators using the proper syntax. They work with the functions of mean, median, and mode in a teacher led lesson and then with a partner on a second data set. They follow...
Curated OER
Collect, organize and compare different data for the Marine Mammals of the Miami Seaquarium, i.e.: size, weight, diet and habitat and how to calculate average, median, mode and range.
Students collect, organize, and compare different data and develop statistical methods such as: average, median, mode and range as a way for decision making by constructing table
Curated OER
Collecting, organizing and comparing data for cellular telephone buying and calculating average, and median price and best deal per cost.
Pupils research data and develop statistical methods such as mean and median price and make convincing arguments as powerful ways for decision making.
Curated OER
Mean, Median, and Mode
Fourth graders compare two sets of data by using a double bar graph. For this data analysis lesson, 4th graders study a double bar graph and complete questions based upon the data. Students construct a table to show the data from the...
Centre for Innovation in Mathematics Teaching
Ten Data Analysis Activities
This thirteen page data analysis worksheet contains a number of interesting problems regarding statistics. The activities cover the concepts of average measurements, standard deviation, box and whisker plots, quartiles, frequency...
Curated OER
Indy 500
Start your engines! Small groups collect data from websites pertaining to the Indianapolis 500 in order to determine average speed per lap and miles in each lap. The lesson requires prior knowledge of the the formula d=rt.
EngageNY
Measuring Variability for Skewed Distributions (Interquartile Range)
Should the standard deviation be used for all distributions? Pupils know that the median is a better description of the center for skewed distributions; therefore, they will need a variability measure about the median for those...
Curated OER
Math Games for Upper Elementary Students
Keeping skills sharp doesn't have to be a chore. It can be done with math games.
Laboratory for Atmospheric and Space Physics
Growing Up With A Mission
New Horizons began its journey to Pluto in 2006. Ten years later, it continues its mission. In that time, scholars have surely grown, but how much more will they grow by the time New Horizons reaches its destination? Find out with an...
Curated OER
Pick A Number
Elementary schoolers find out which month has the most class birthdays (mode) and which birthday represents the middle point of all the birthdays (median). They gather and organize data to find one number that fairly represents the whole...
American Institutes for Research
Digital Smiles
Explore metric measurement, recording data, and creating an electronic spreadsheet displaying results with your math class. Scholars will measure the length of their smiles, record the measurements, and represent the results on an...
Curated OER
Mathematical Modeling
Study various types of mathematical models in this math lesson plan. Learners calculate the slope to determine the risk in a situation described. They respond to a number of questions and analyze their statistical data. Then, they...
American Statistical Association
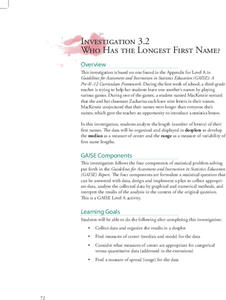
Who Has the Longest First Name?
Name that statistic! Classmates each write their name and the number of letters in it on a sticky note to place on the board. As a class, they determine the median, mode, and range of the name lengths, and create a dot plot of the data....
American Statistical Association
Speedster
Catch me if you can. Scholars collect data on reaction time by catching a falling ruler or by using an Internet app. They determine the median of the data, create graphs, and analyze the results. They also compare their data to the rest...
Other popular searches
- Mean, Median, Mode
- Mean Median Mode
- Graphing Mean, Median, Mode
- Free Mean, Median, Mode
- Math; Mean, Median, Mode
- Mean Median Mode Range
- Mean, Median, Mode Range
- Mean Median and Mode
- Mathematics Mode and Median
- Median and Mean Statistics
- Mean, Median, Mode, Range
- Mean Median


