CK-12 Foundation
Ck 12: Measures of Central Tendency and Dispersion Grade 8
[Free Registration/Login may be required to access all resource tools.] Find the mean, median, mode and range of a data set.
CK-12 Foundation
Ck 12: Measures of Central Tendency and Dispersion Grades 11 12
[Free Registration/Login may be required to access all resource tools.] This Concept introduces students to the most common measures of central tendency: the mean, median and mode.
Curated OER
Image for Mean
An overview of the statistical term, "mean." An example is provided for explanation. Links are given to other related terms: central limit theorem, population, median, and mode.
Alabama Learning Exchange
Alex: My Peanut Butter Is Better Than Yours!
The students will engage in the process of statistical data comparing data using tables and scatterplots. The students will compare data using measures of center (mean and median) and measures of spread (range). This instructional...
University of Texas
Inside Mathematics: Baseball Players [Pdf]
This task challenges students to demonstrate understanding of the concept of measure of center.
Stefan Warner and Steven R. Costenoble
Finite Mathematics & Applied Calculus: Measures of Central Tendency
Students learn about measures of central tendency. Topics explored are mean, median, mode, and expected value. The tutorial investigates the statistics concepts through class notes and examples. Review exercises and a chapter quiz are...
Science Education Resource Center at Carleton College
Serc: Nitrate Levels in the Rock Creek Park Watershed: Meas of Central Tendency
Activity uses water-quality data from Rock Creek Park to illustrate elementary statistical measures of exploratory data analysis. The focus of the lesson is the nutrient limitation in a stream and the three measures of central tendency.
Better Lesson
Better Lesson: What Does the Data Tell Us? Describing Data
Understanding how to interpret data by its shape, spread, and center helps students to understand statistics.
Rice University
Hyper Stat Online Statistics Textbook: Summary of Measures of Central Tendency
Site discusses which method of central tendency is most appropriate for different purposes.
Mangahigh
Mangahigh: Data: Use the Range and Mode
This site provides students practice with the concept of range and mode. Students can learn about the topic by completing an interactive tutorial. Students can then take a ten question timed test to practice the skill.
University of Illinois
University of Illinois: Rollin' Rollin' Rollin'
This page from the University of Illinois is the beginning of a series that demonstrates the difference between the mean and median of a group of numbers. The sites use bar graphs to display the data.
Soft Schools
Soft Schools: Outliers
On this websites students explore the concept of outliers. Students are given several data sets and investigate how outliers can effect the mean and median of a data set.
University of Illinois
University of Illinois: Rollin' Rollin' Rollin'
This resource is the beginning of a series of pages that demonstrates the diffference between the mean and median of a group of numbers. Uses bar graphs to display the data.
Khan Academy
Khan Academy: Normal Distributions Review
Normal distributions come up time and time again in statistics. A normal distribution has some interesting properties: it has a bell shape, the mean and median are equal, and 68% of the data falls within 1 standard deviation.
Education Place
Houghton Mifflin: Eduplace: Math Steps: What Is It? Data
This is a great place for lesson information on the concept of analyzing data - measures of central tendency. Three other tabs are available besides the "What Is It?" link. Tips and Tricks, When Students Ask, and Lesson Ideas also...
Other
Rhl School: Math Problem Solving
Utilize this site for lesson plans and worksheets to help your students with math problem-solving.
Khan Academy
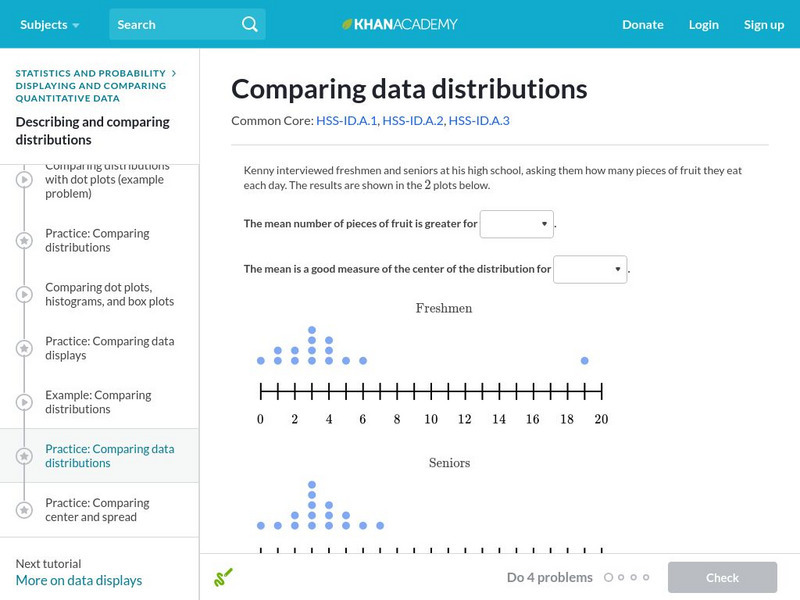
Khan Academy: Comparing Data Distributions
Take a look at two different data distributions and draw some comparisons. Students receive immediate feedback and have the opportunity to try questions repeatedly, watch a video or receive hints.
E-learning for Kids
E Learning for Kids: Math: Music Center: Mixed Problem Solving
Help Dracco the drummer with solving different fun math problems.
CK-12 Foundation
Ck 12: Measures of Central Tendency and Dispersion Grades 8 9
[Free Registration/Login may be required to access all resource tools.] Learn how to calculate different measures of central tendency, as well as the spread or dispersion of the data.
CK-12 Foundation
Ck 12: Measures of Central Tendency and Dispersion Grades 9 10
[Free Registration/Login may be required to access all resource tools.] Decide which measure of central tendency best describes a data set.
CK-12 Foundation
Ck 12: Measures of Central Tendency and Dispersion Grades 9 10
[Free Registration/Login may be required to access all resource tools.] Decide which measure of central tendency best describes a data set.
Beacon Learning Center
Beacon Learning Center: All That Data 2
Students describe graphs and explore range, measures of central tendency, and distribution in this interactive web lesson.
Math Is Fun
Math Is Fun: How to Find the Mode
This website gives a clear, simple explanation of how to find a mode.
University of Wisconsin
University of Wisconsin: Measures of Central Tendency
This resource provides information about measures of central tendency.


